Final Design


Usability Test Results
Overall Feedback
The general feedback for AirAware has been positive, with users finding the app helpful. However, they have suggested some improvements, enhancing the tips in the dynamic map feature and allowing more customization options for the homepage to better tailor the information to individual needs and preferences.
Areas for Improvement:
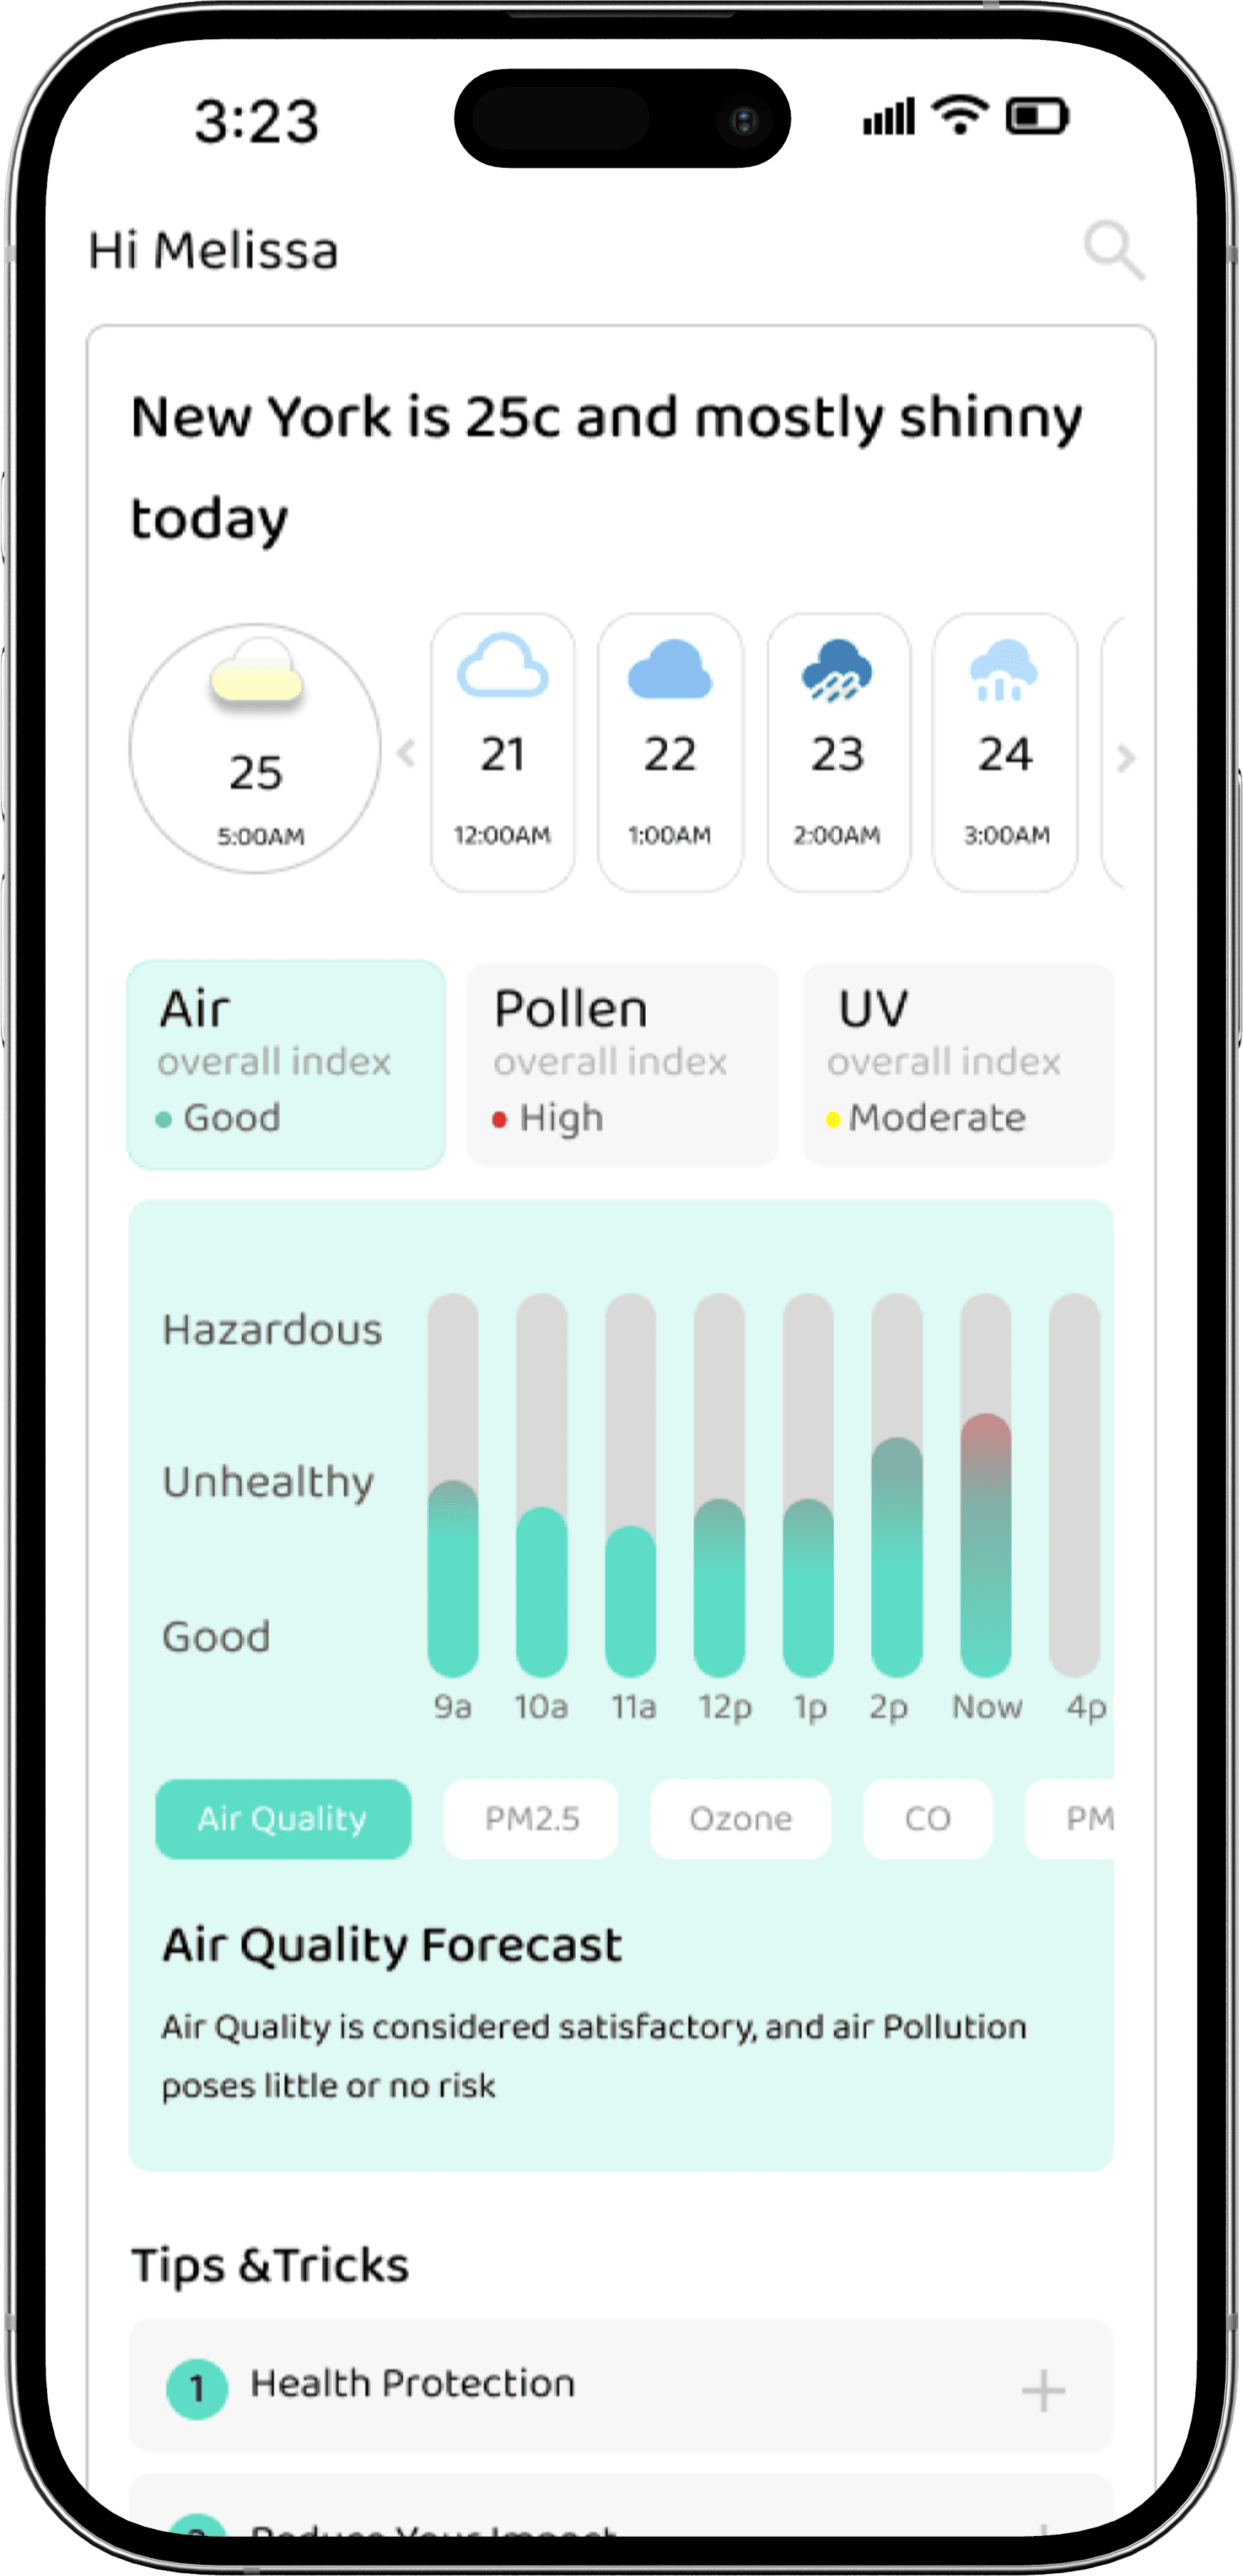
Customizable Dashboard:
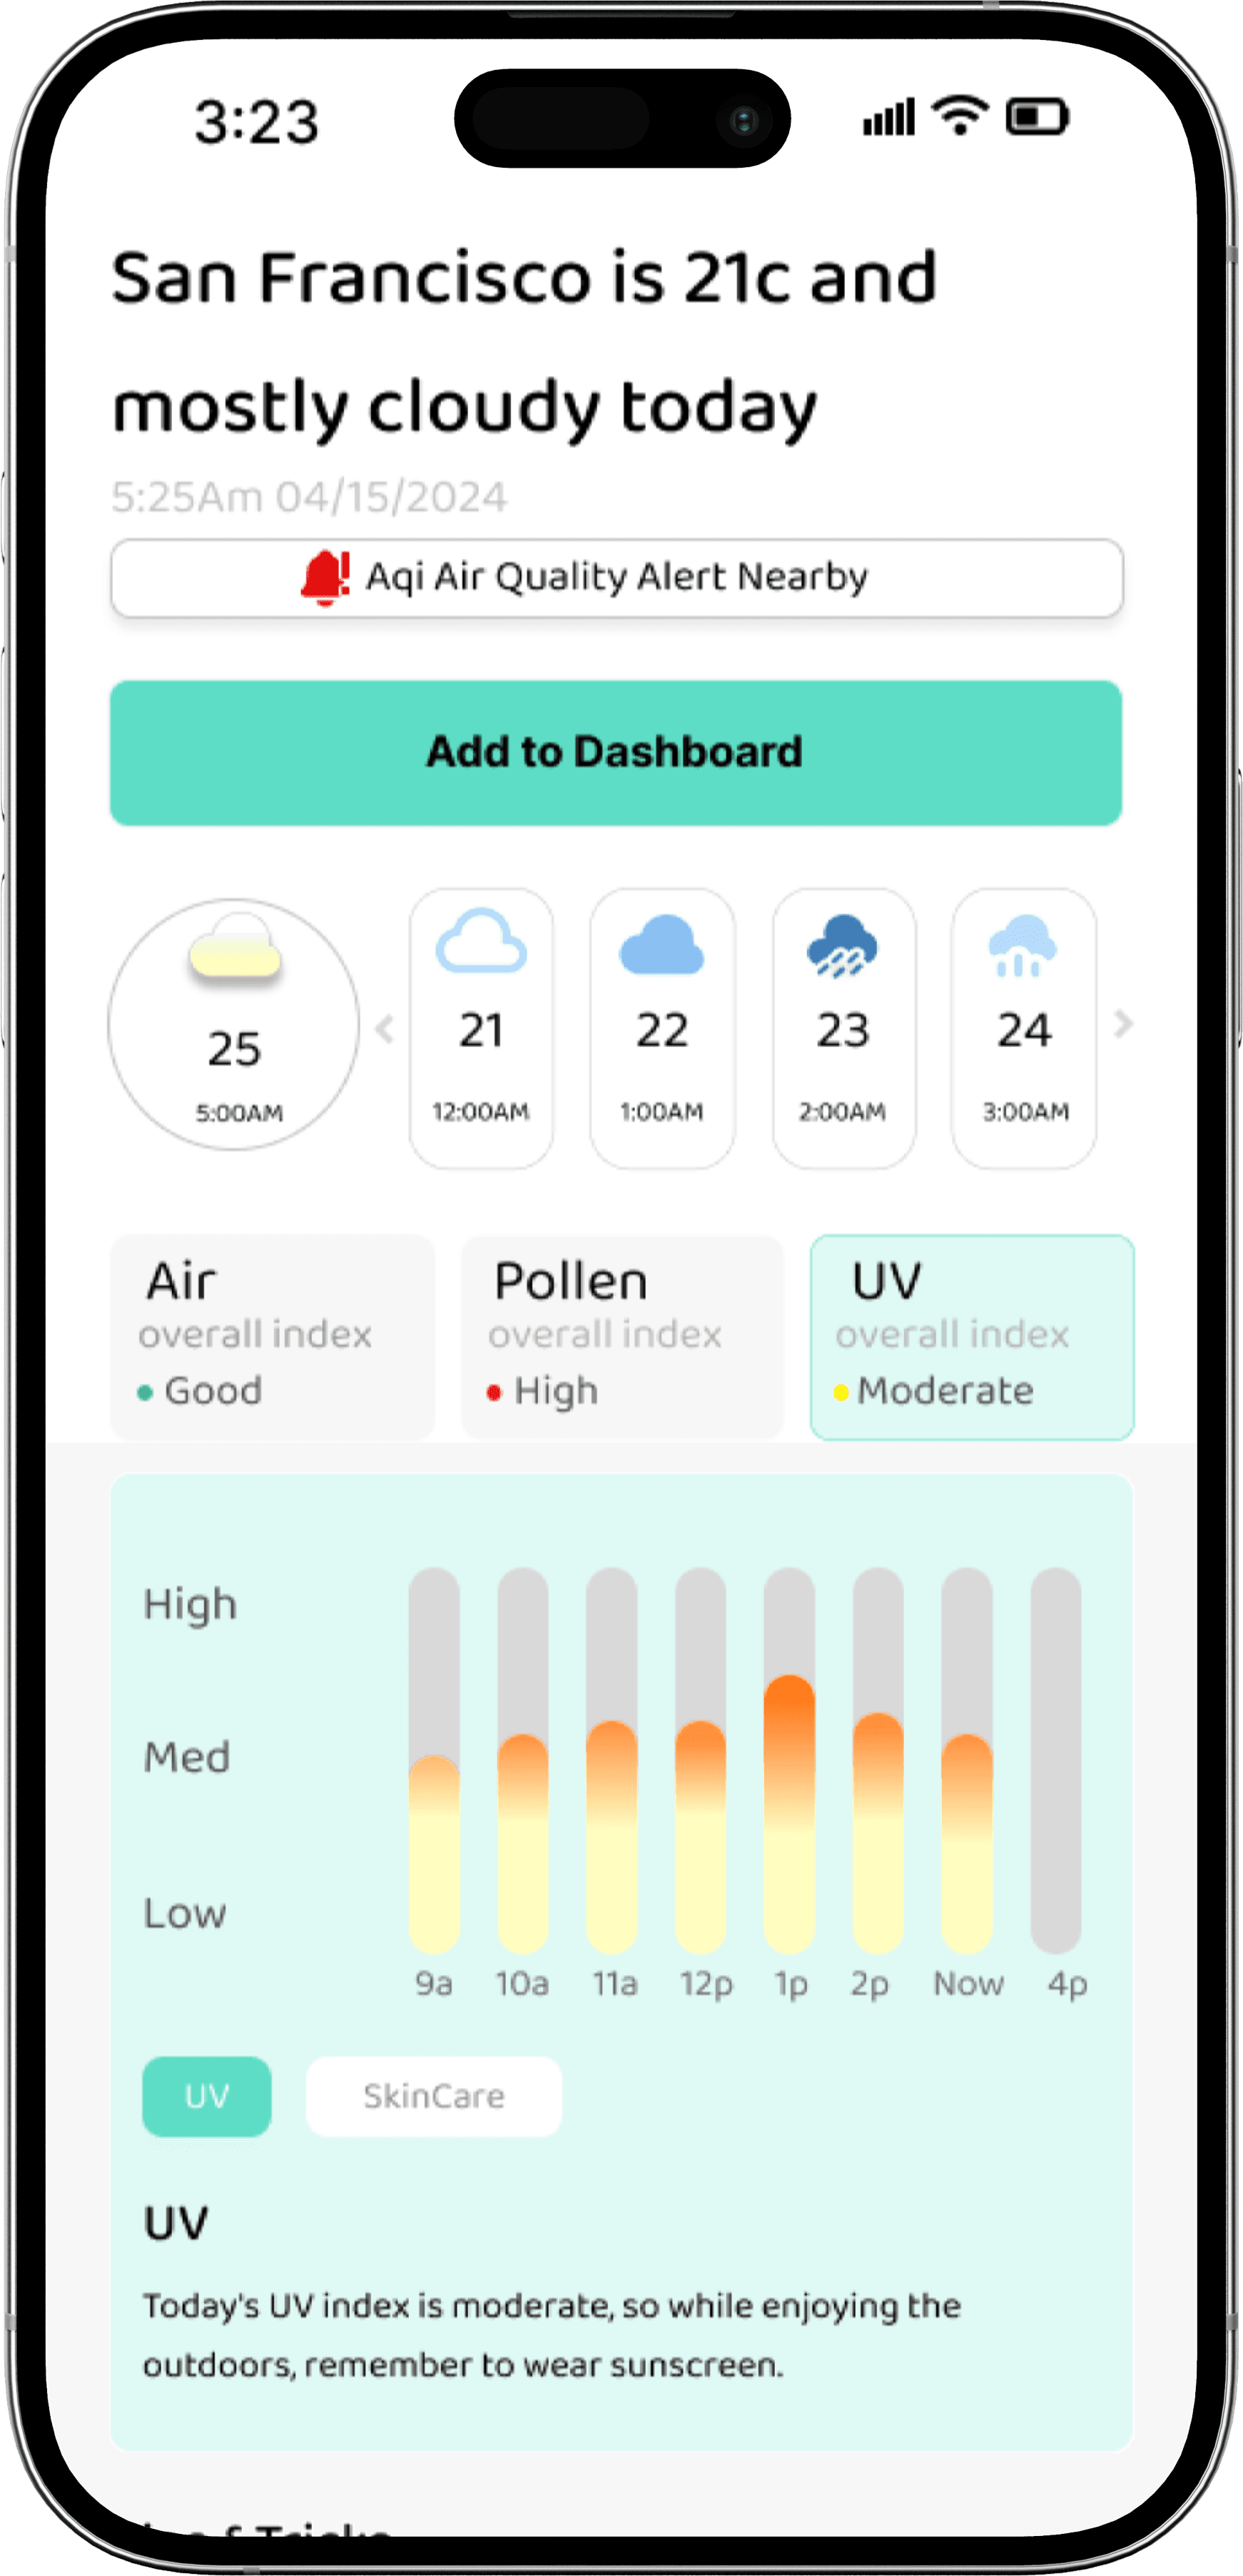
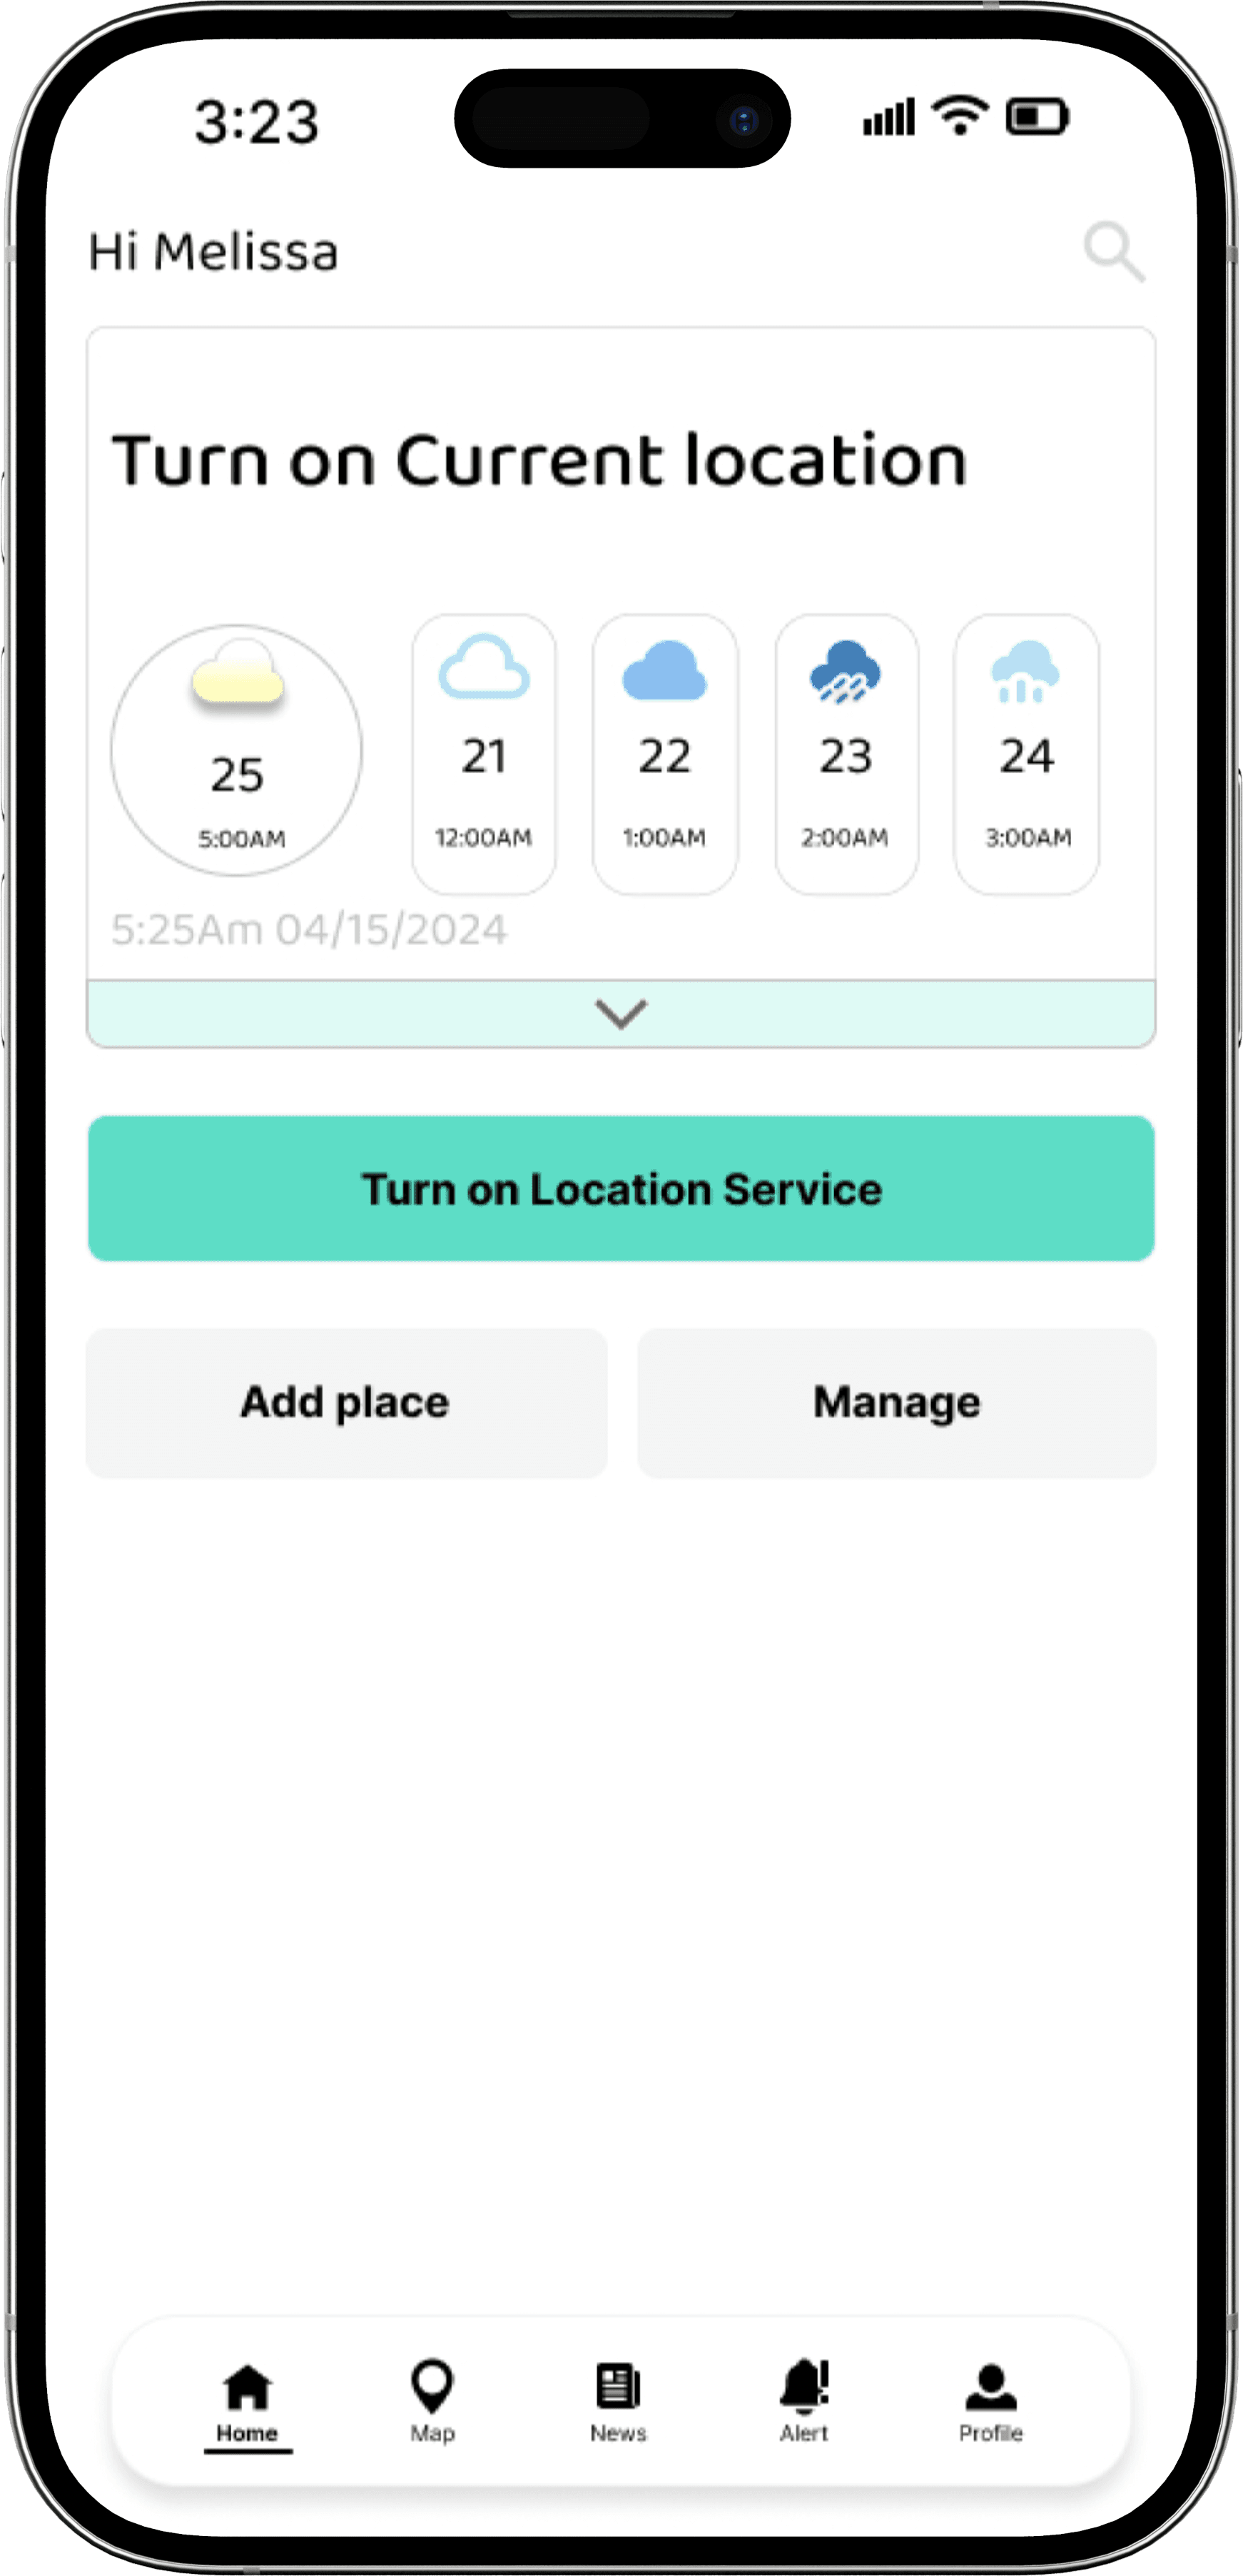
Users desired a more customizable dashboard where they could choose which information is displayed prominently, such as specific pollutants or health recommendations, to tailor the app more closely to their personal needs and interests.
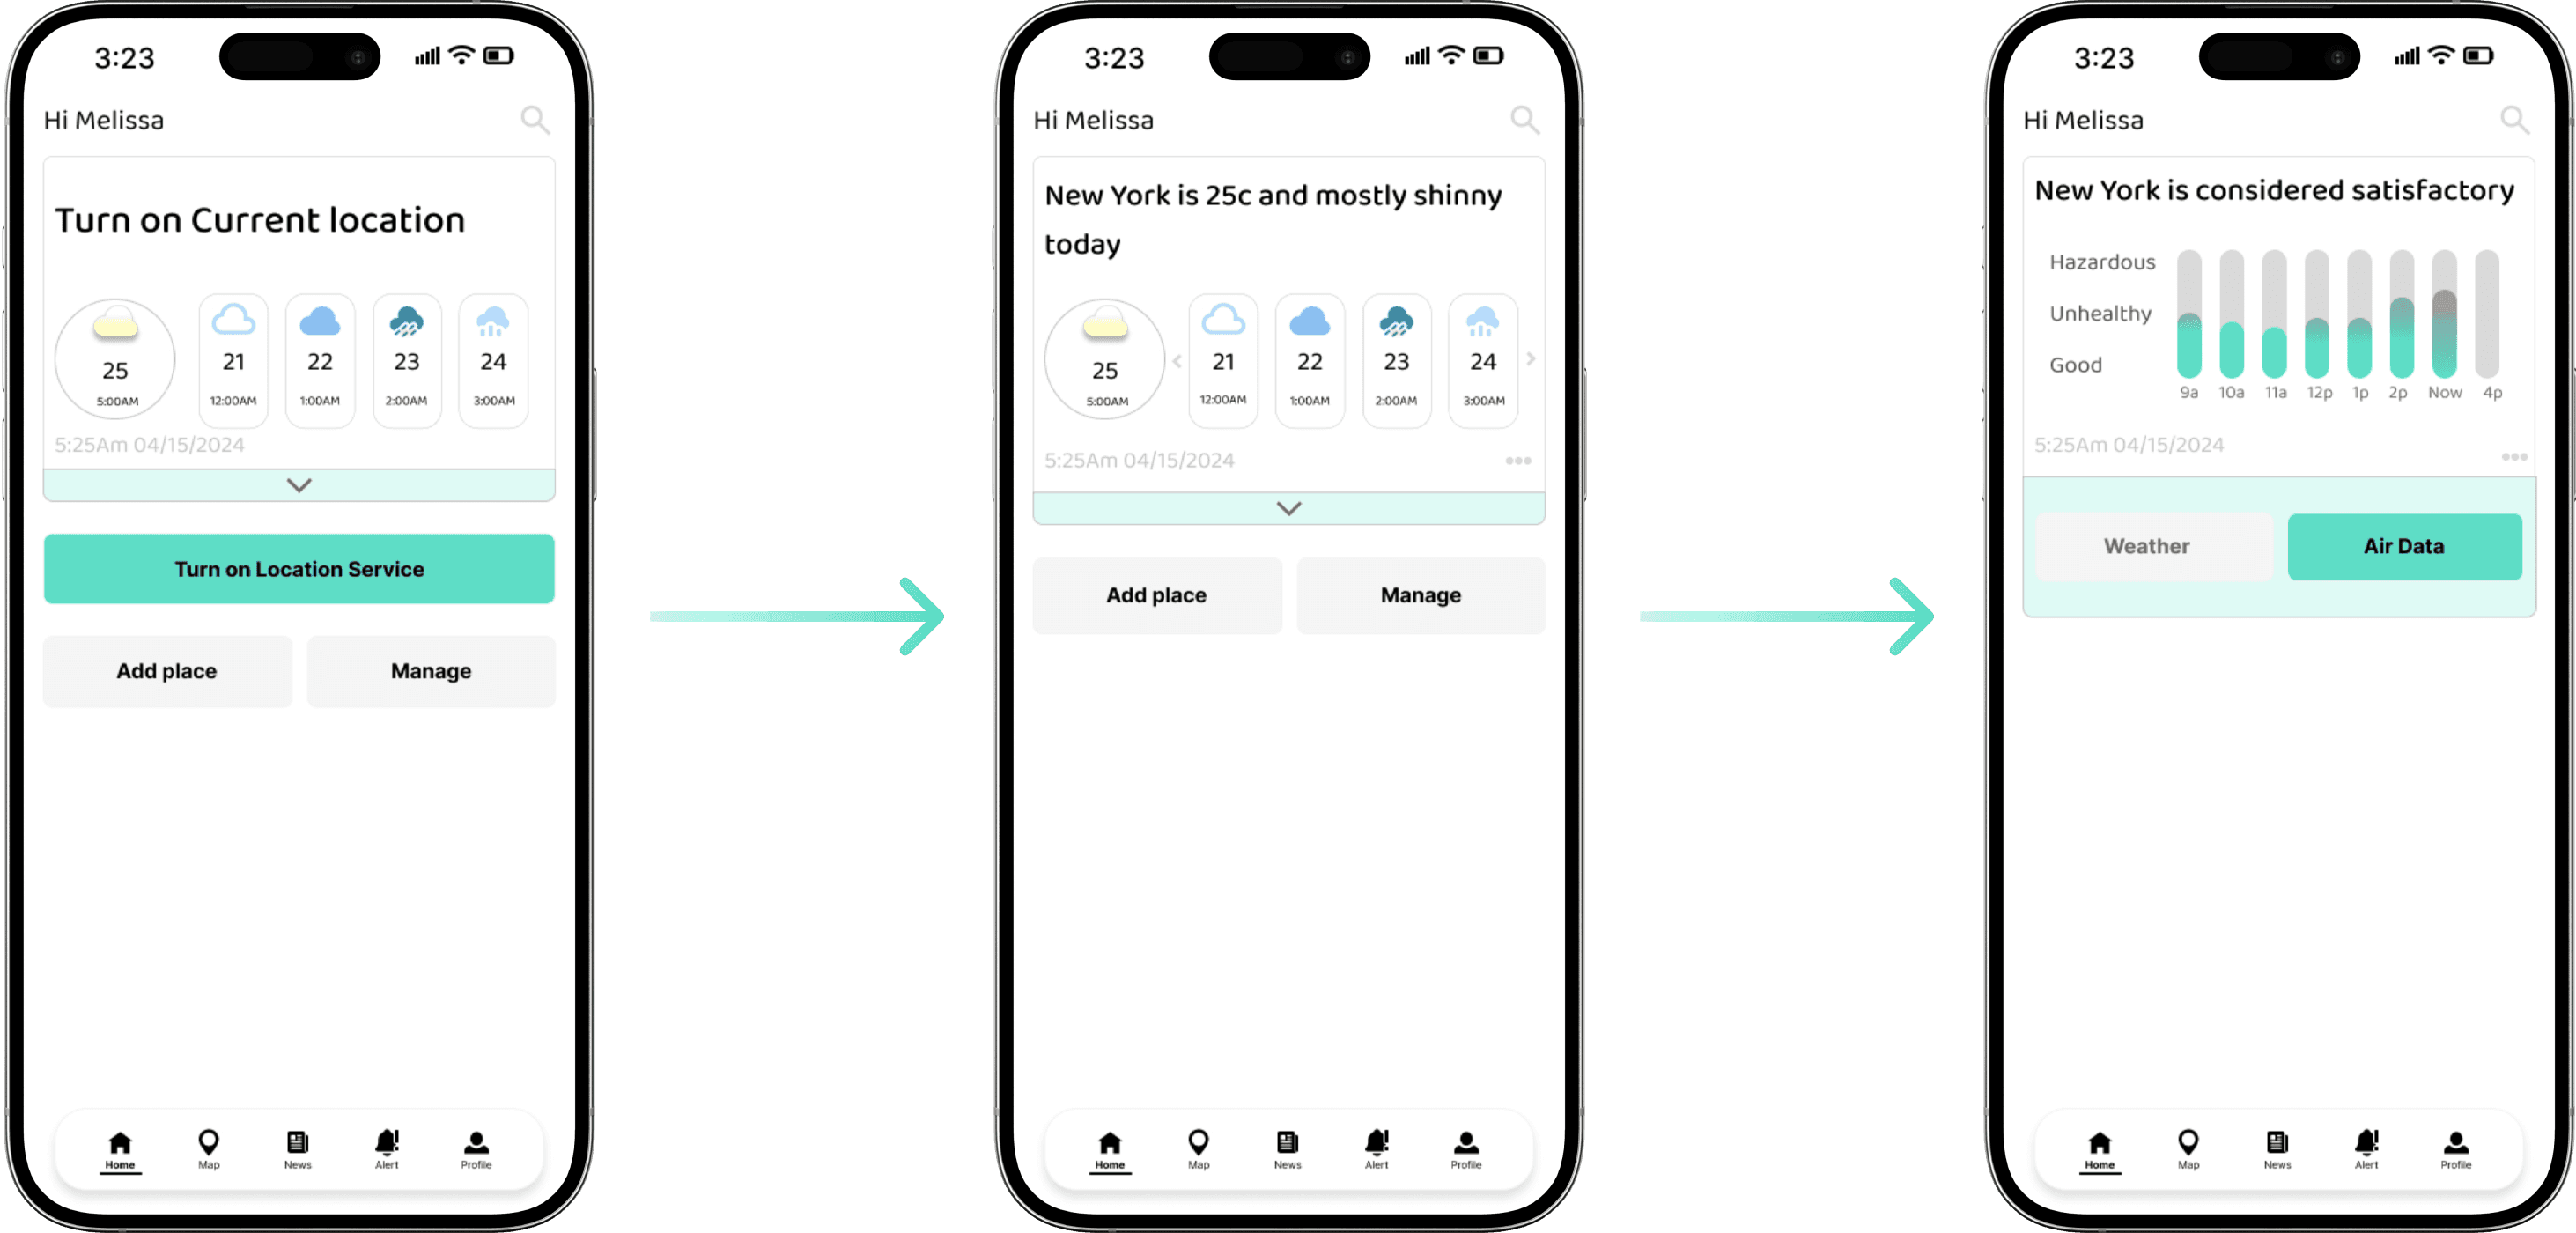
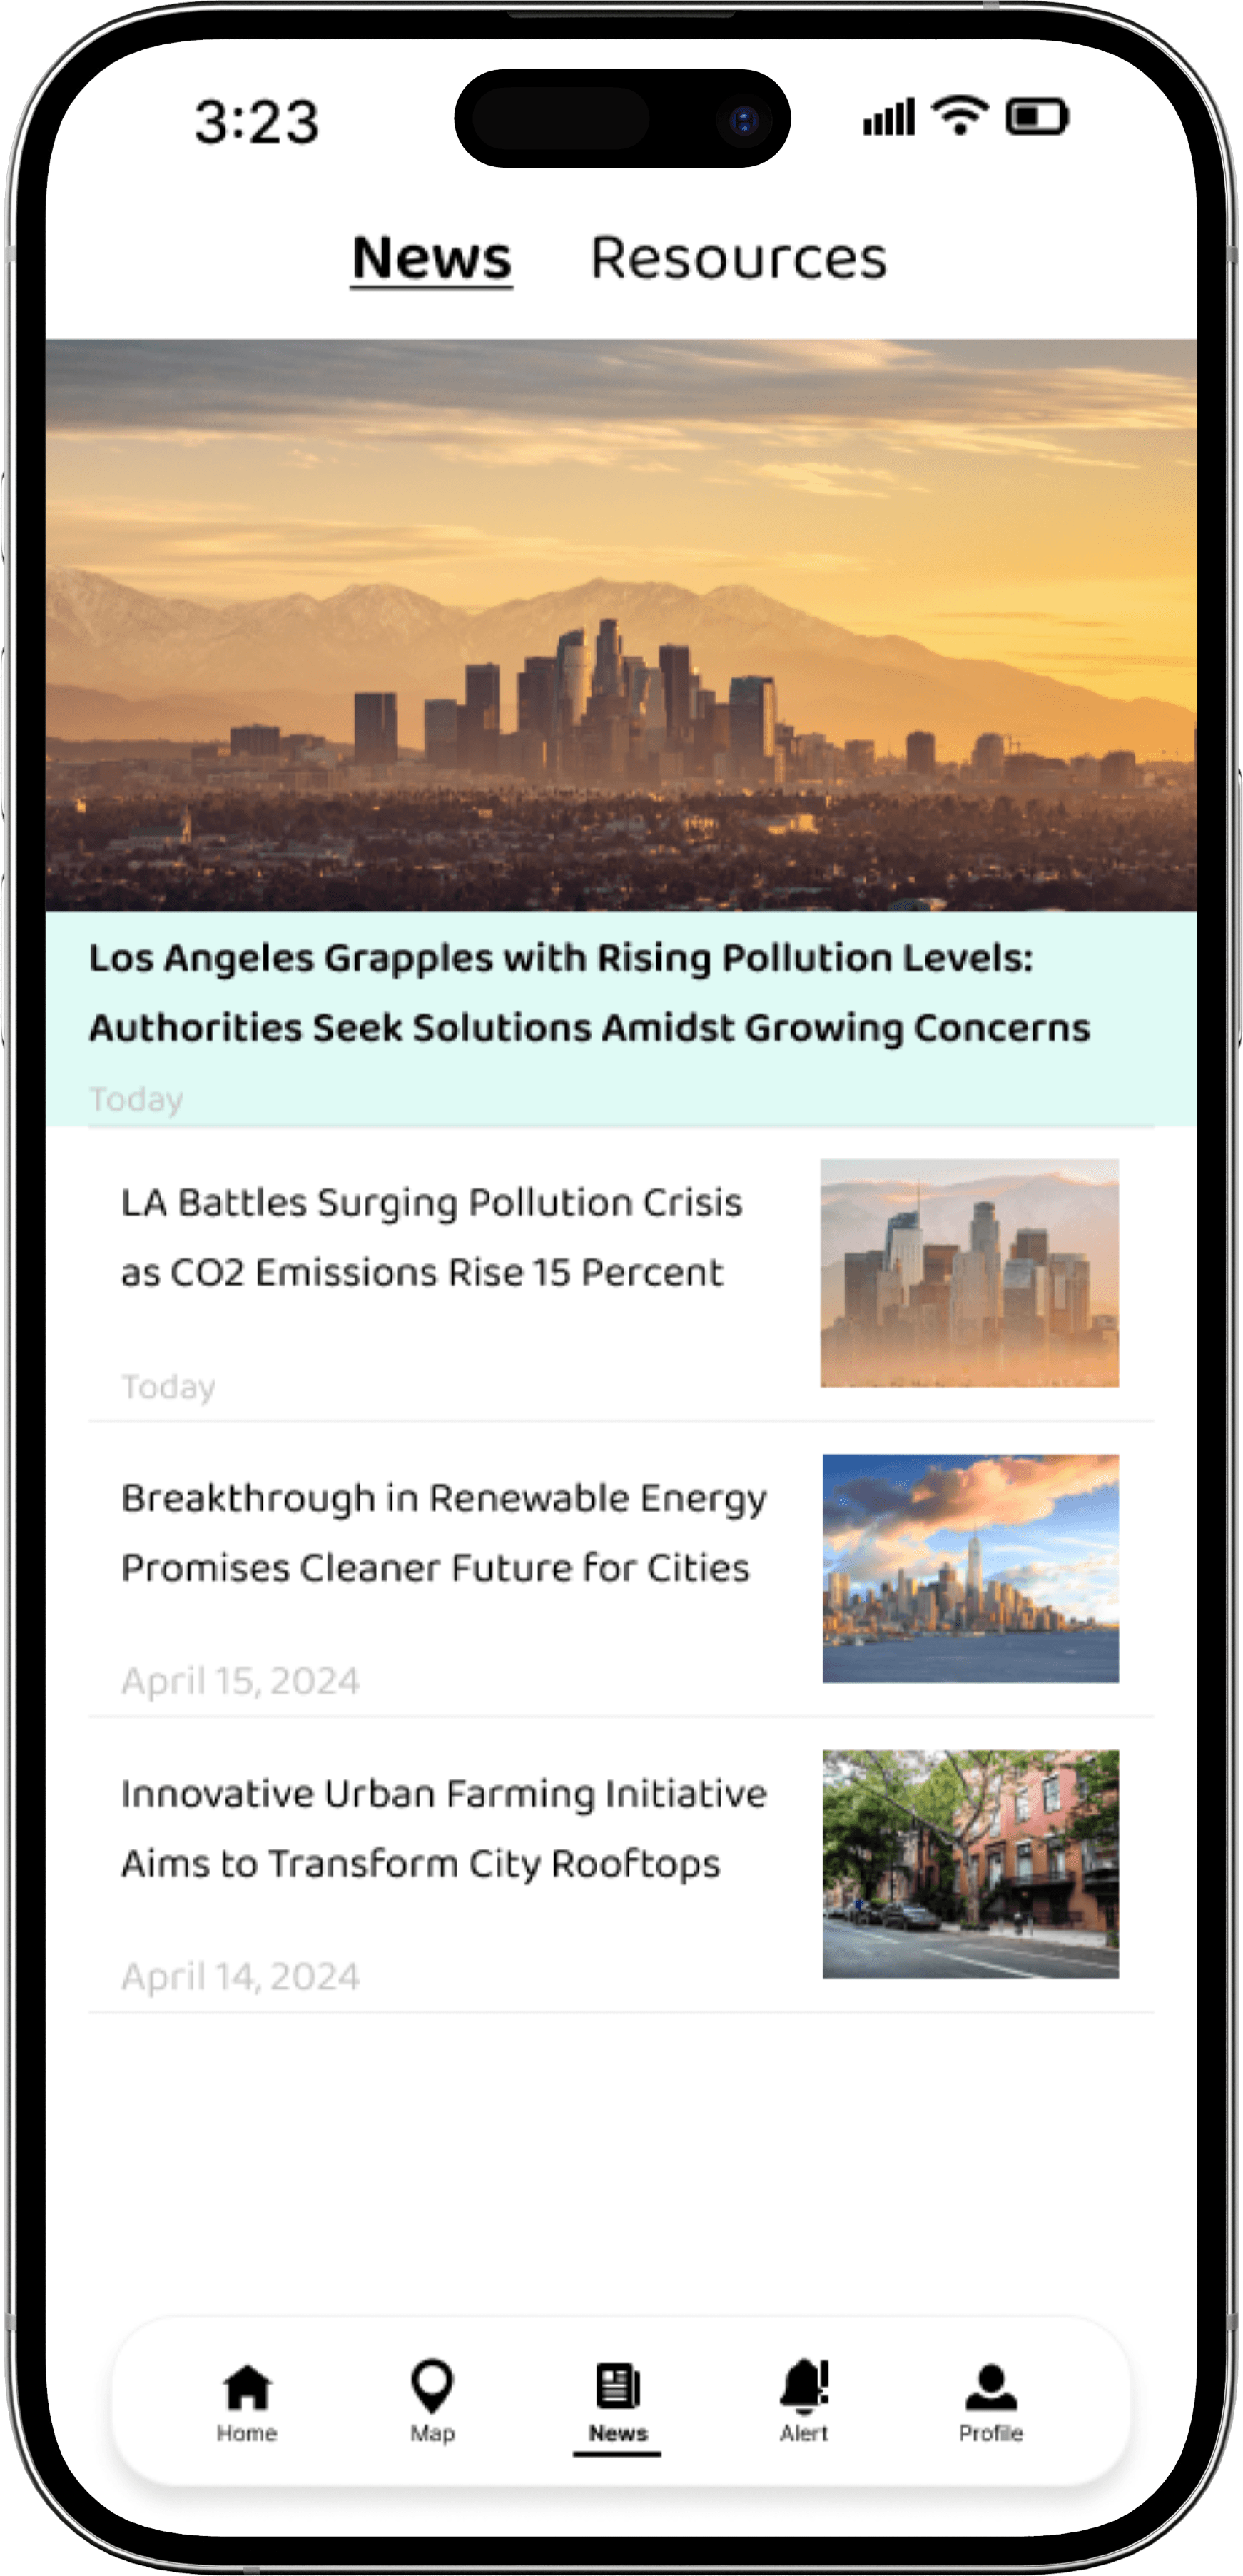
Now the user can choose between weather and Pollution data
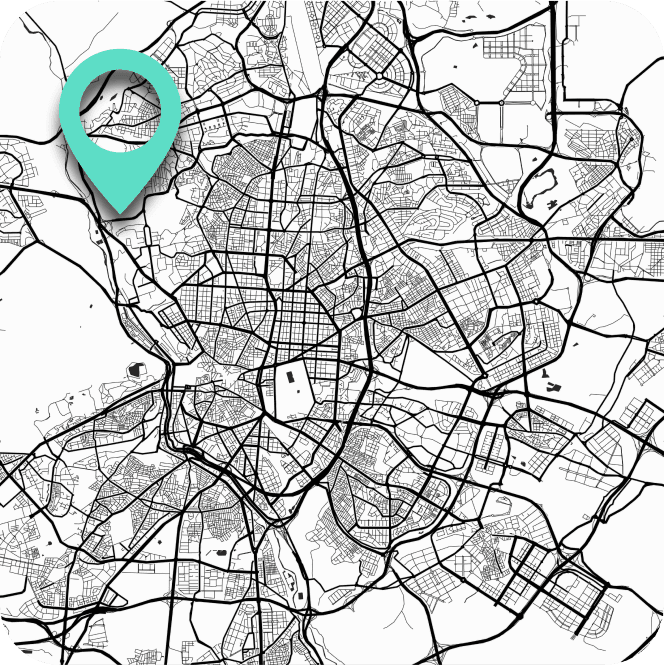
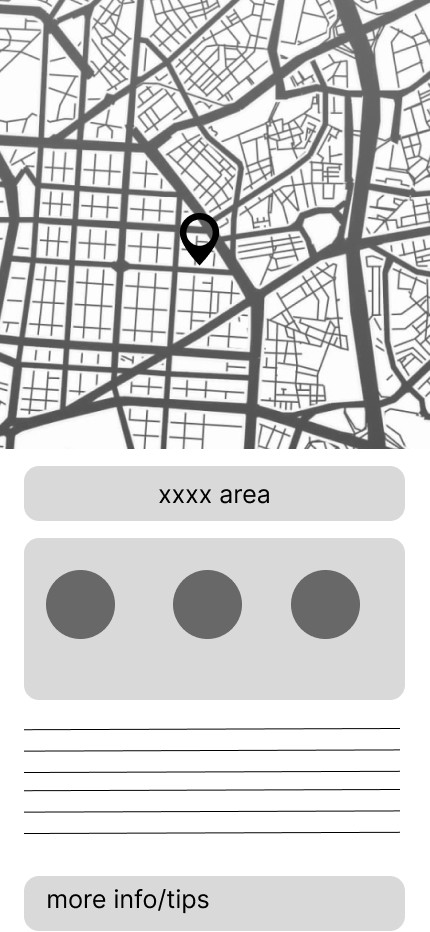
Tips and guides:
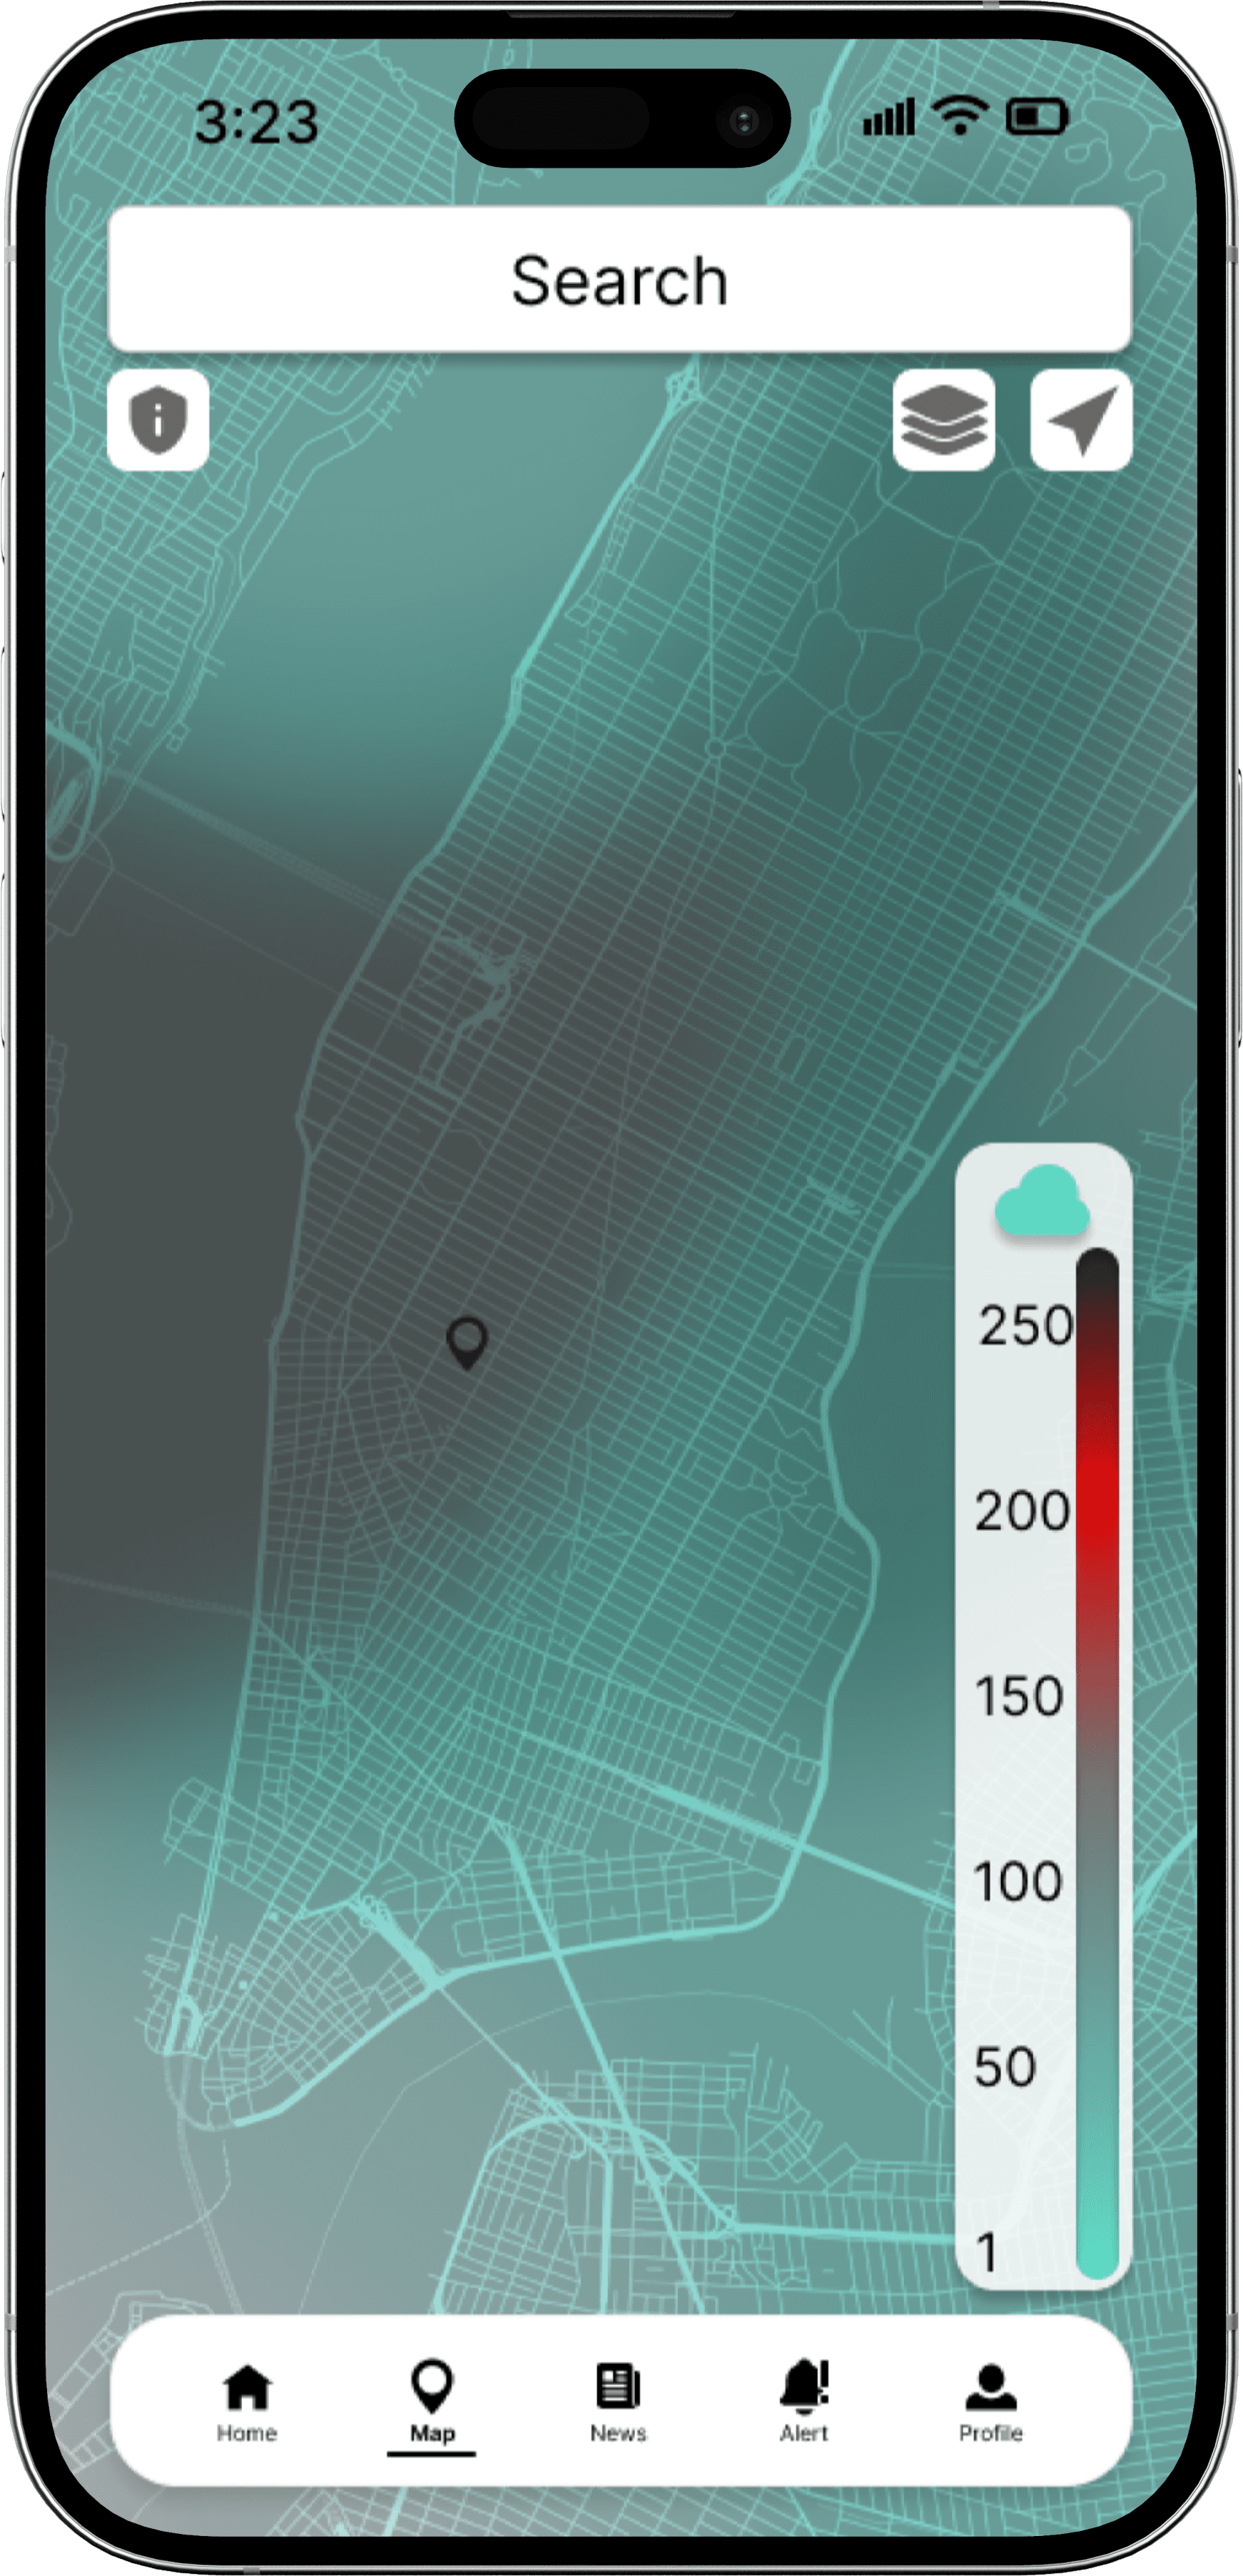
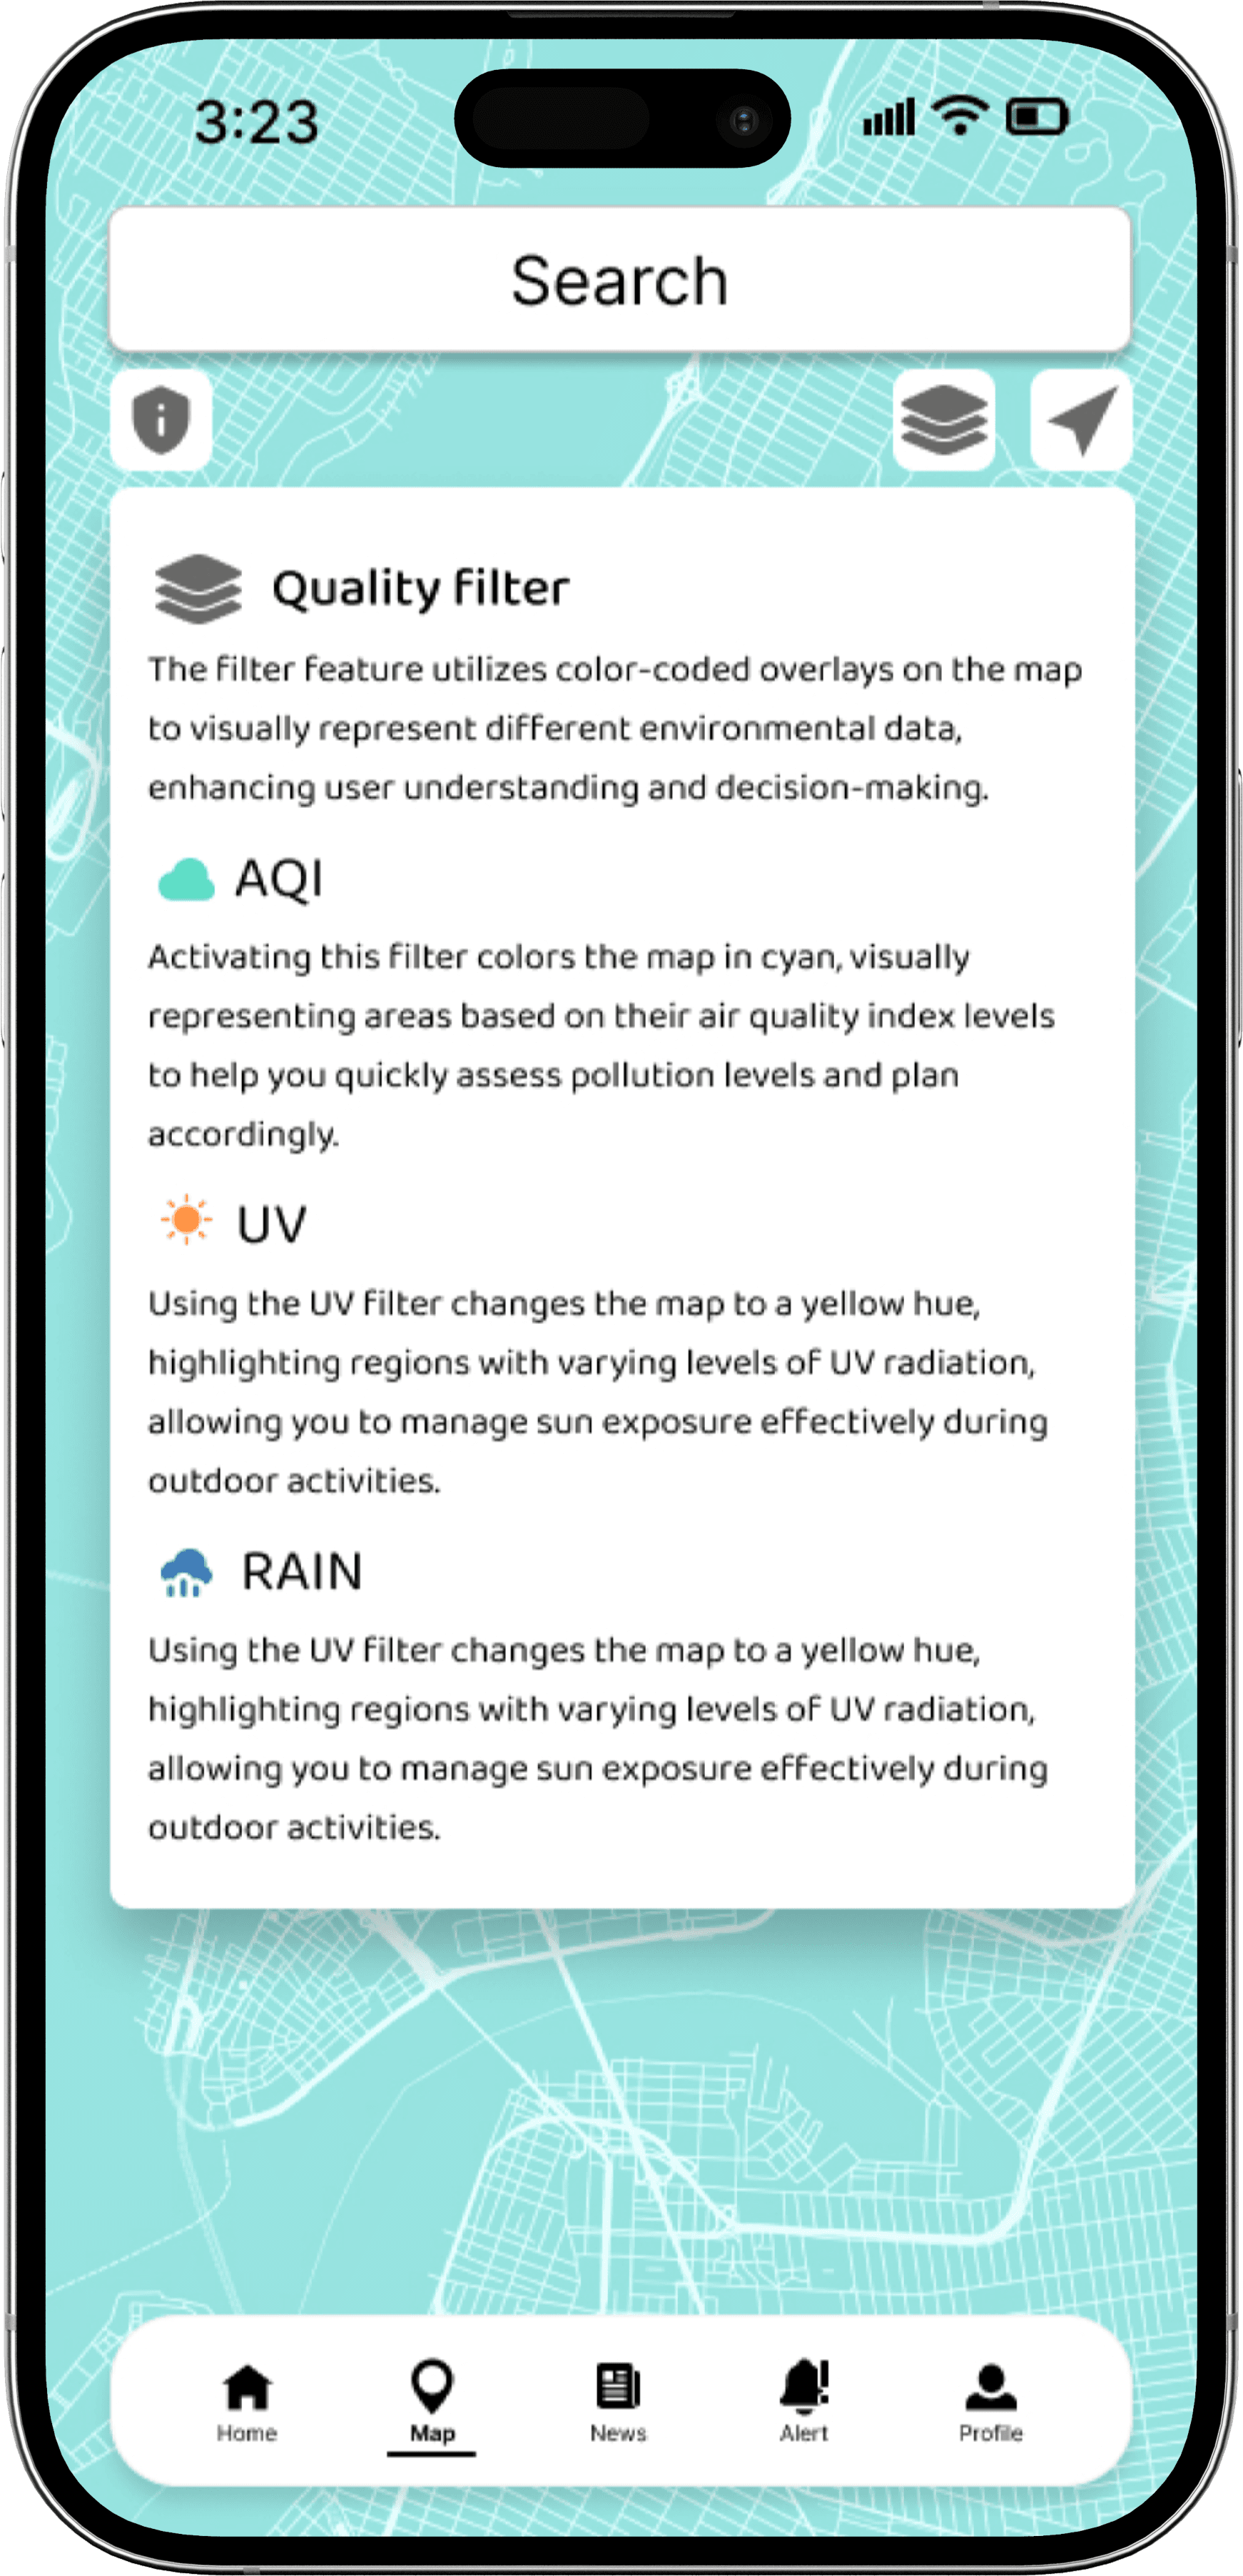
Include additional guidance or tooltips for first-time users interacting with the map feature. This enhancement could ensure that all users fully understand how to utilize this tool effectively, maximizing its potential without causing confusion or a sense of being overwhelmed.

The tips now helps the user to understand the filter system better
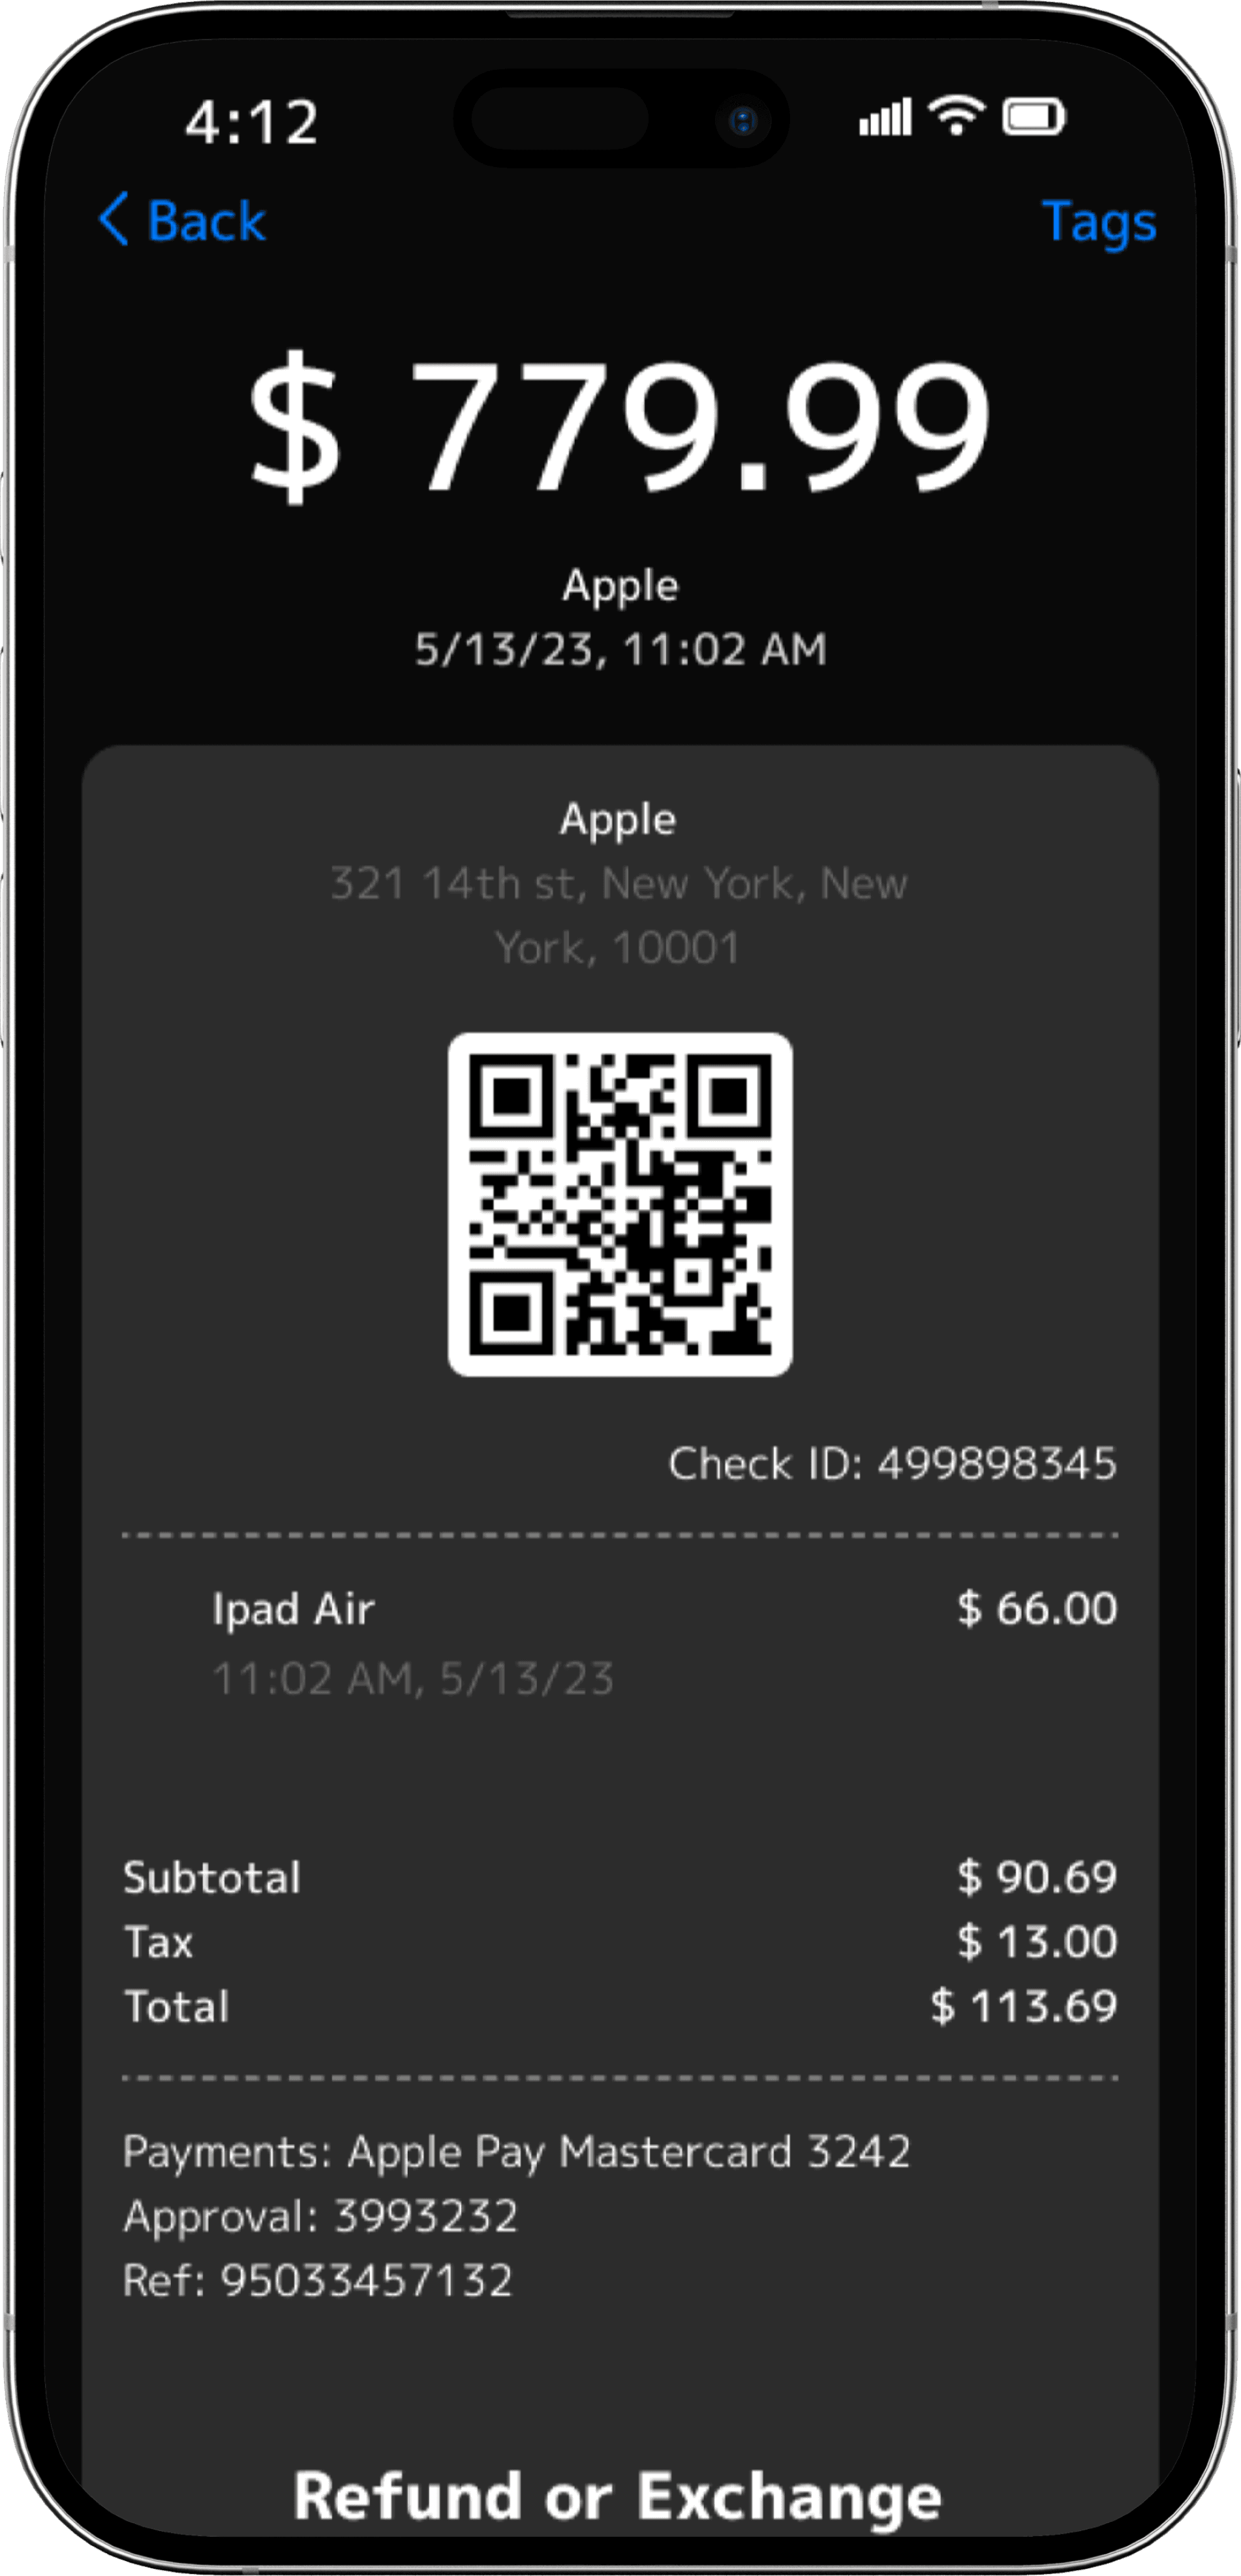
Next Gen Receipts & Receipts management
Apple E-Receipt

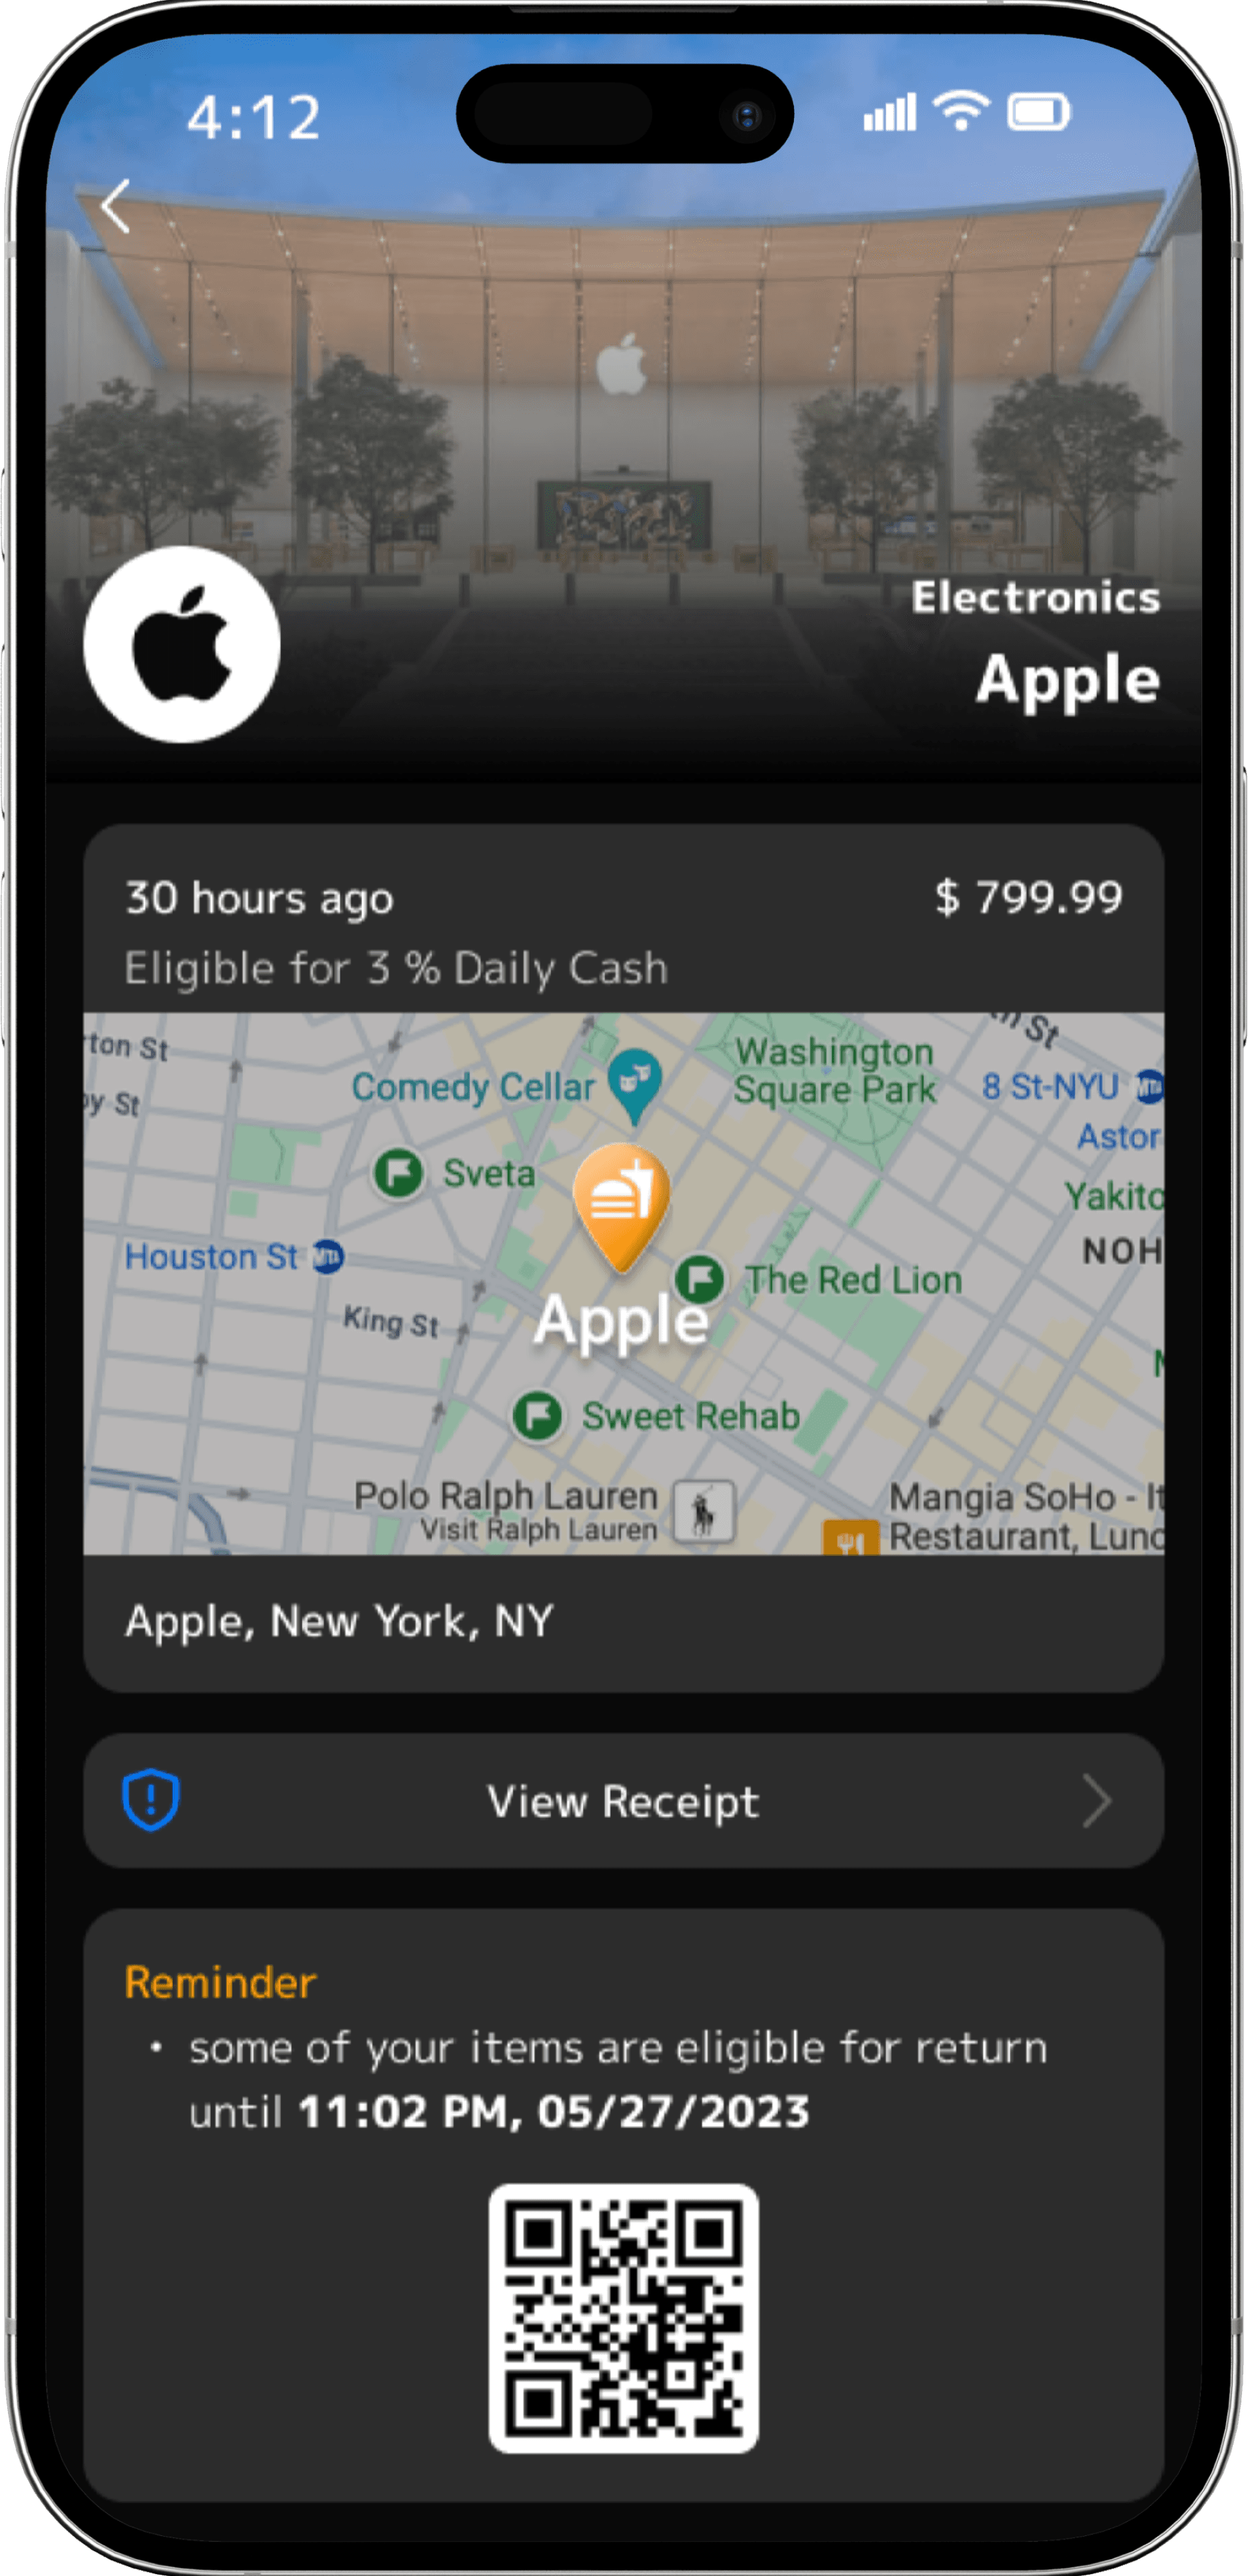
Apple Wallet Feature
UX Research
UX/UI Design
Usability Test
Preferred
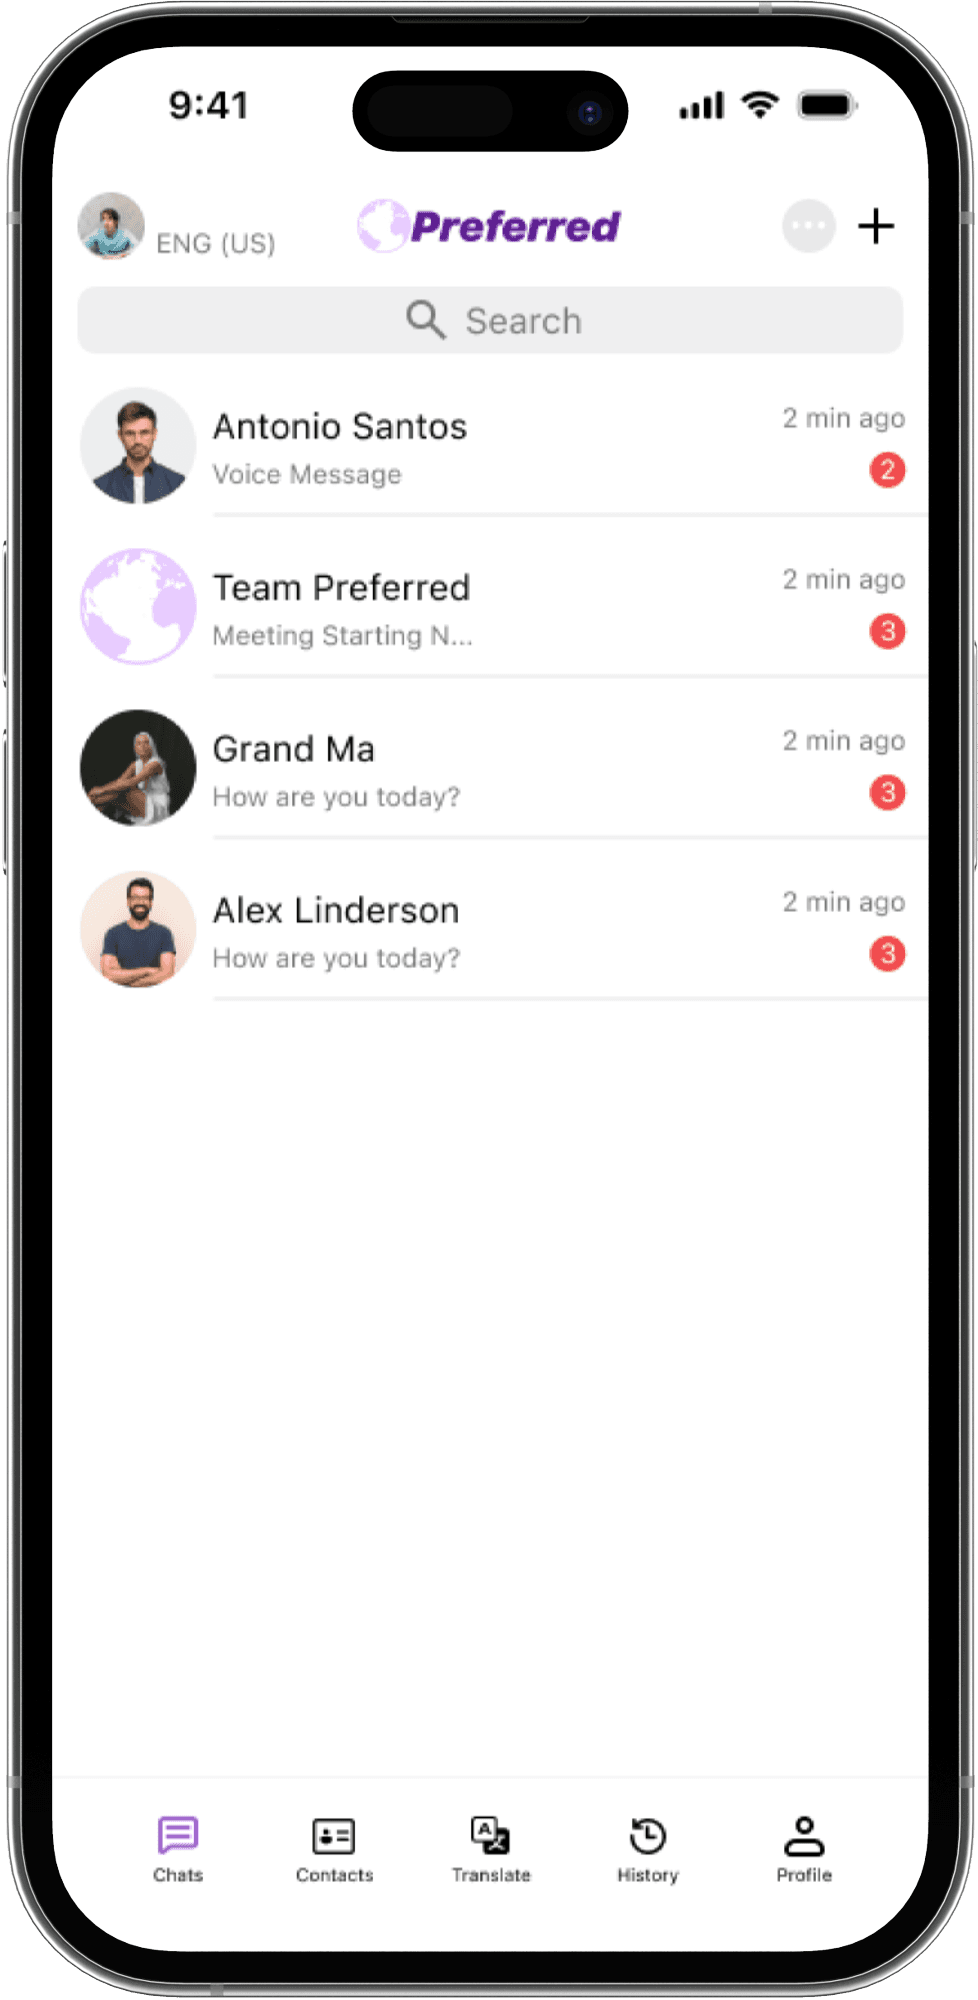
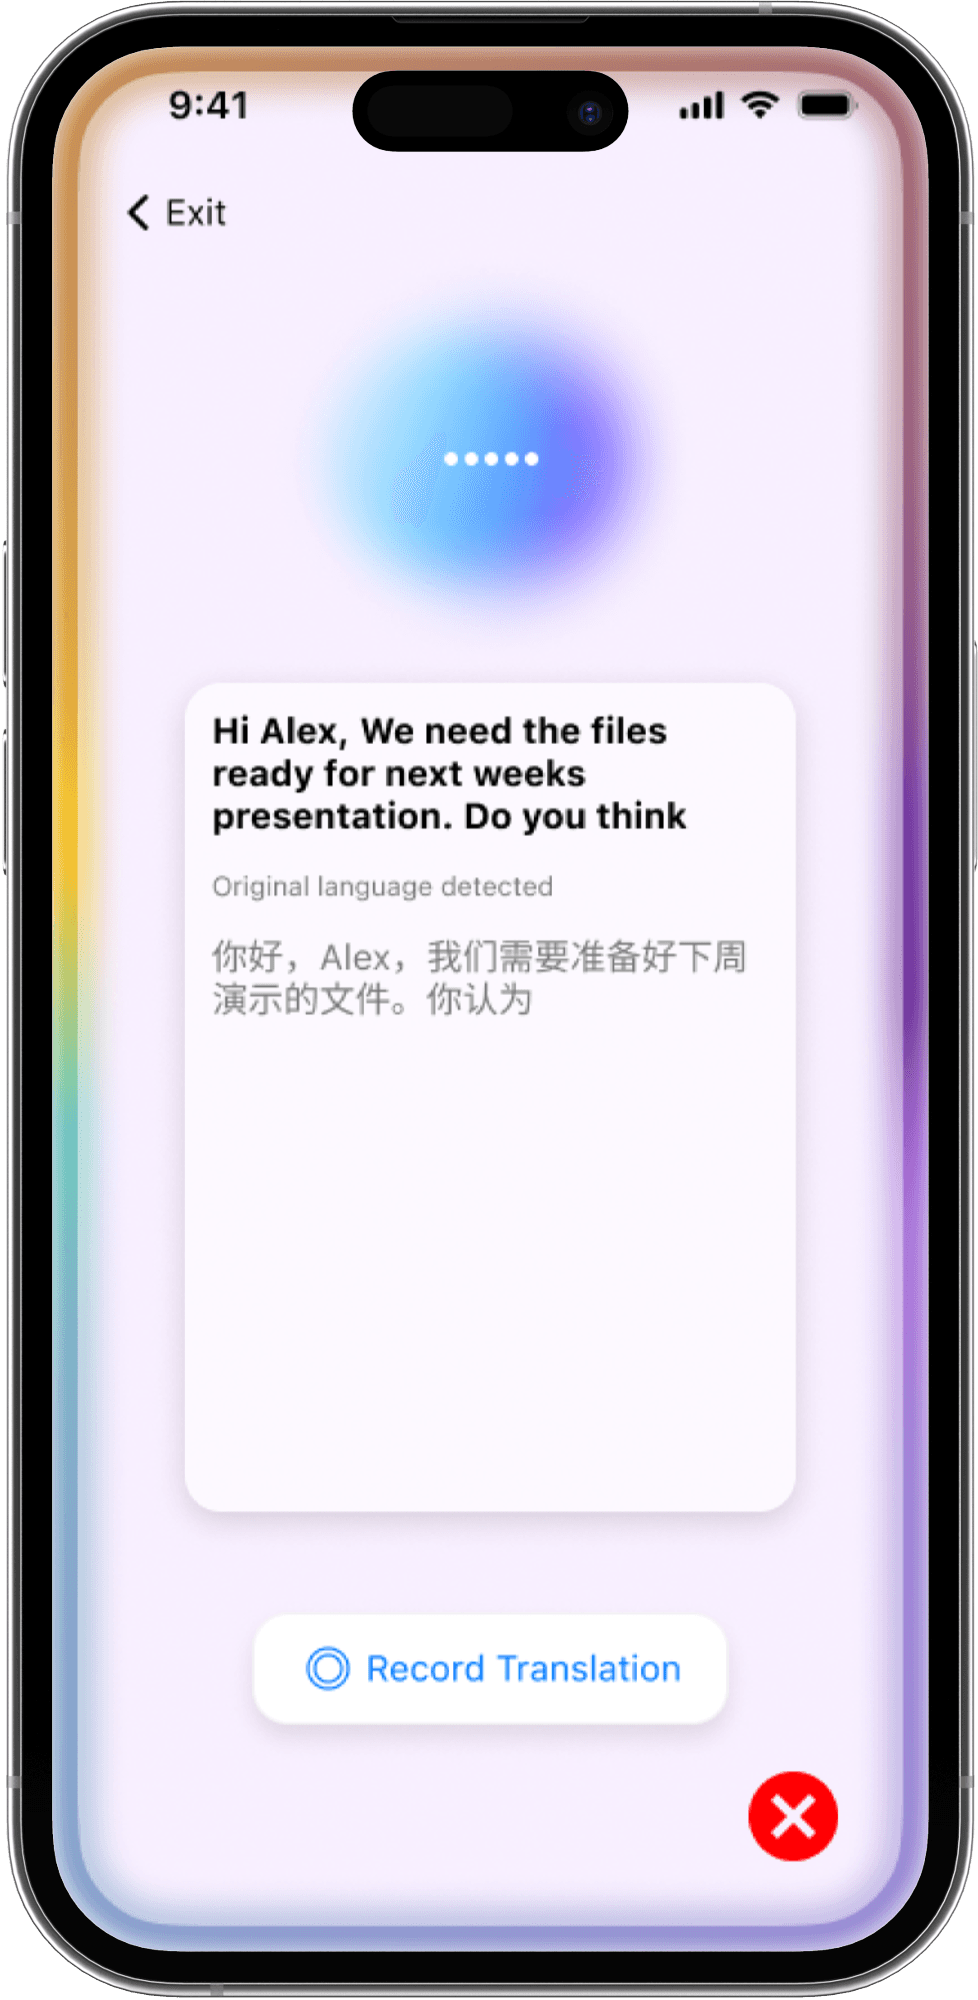
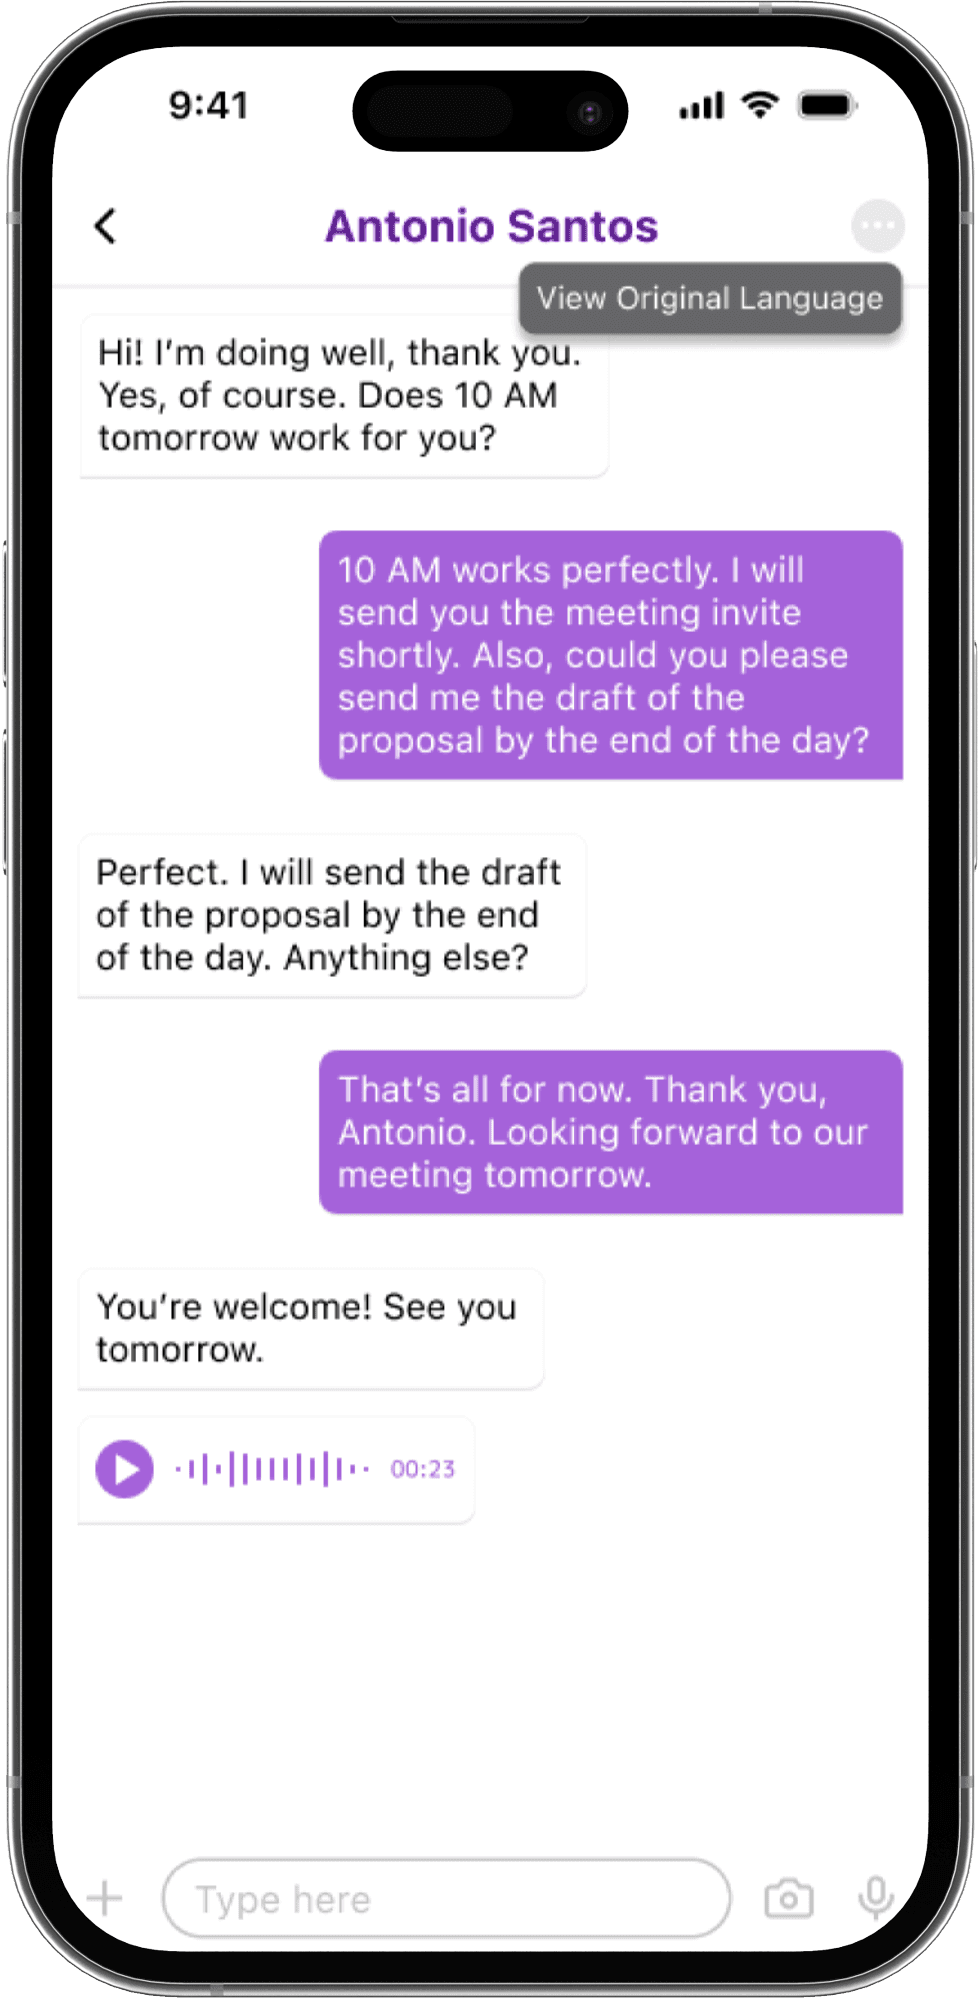
Preferred is a real-time translation app that seamlessly bridges language barriers for text, voice, and video communications, enhancing global communication and collaboration.
0-1
UX Research
UX/UI Design
Usability Test
Dreamer Cruise
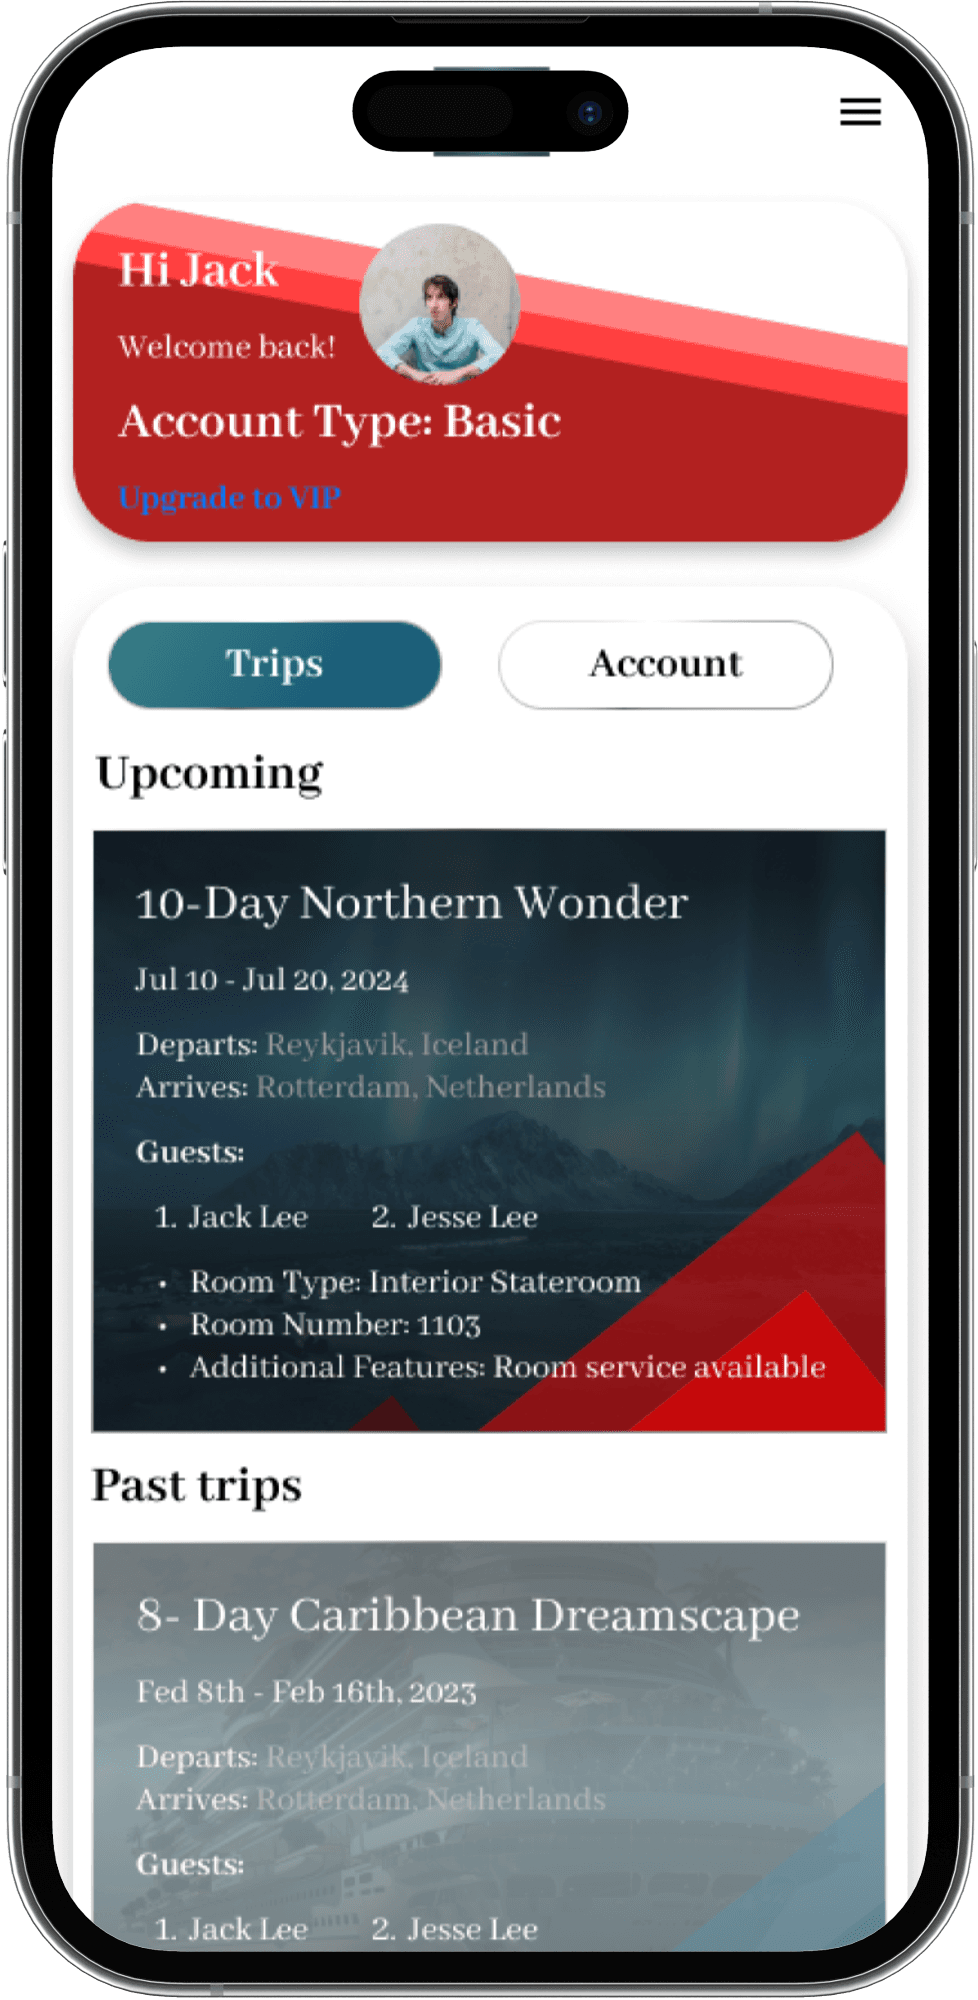
An unparalleled luxury cruising experience, combining world-class amenities, exquisite dining, and immersive virtual tours to create unforgettable journeys.
Website design
UX Research
UX/UI Design

View More Project
Project takeaway &
Next Steps
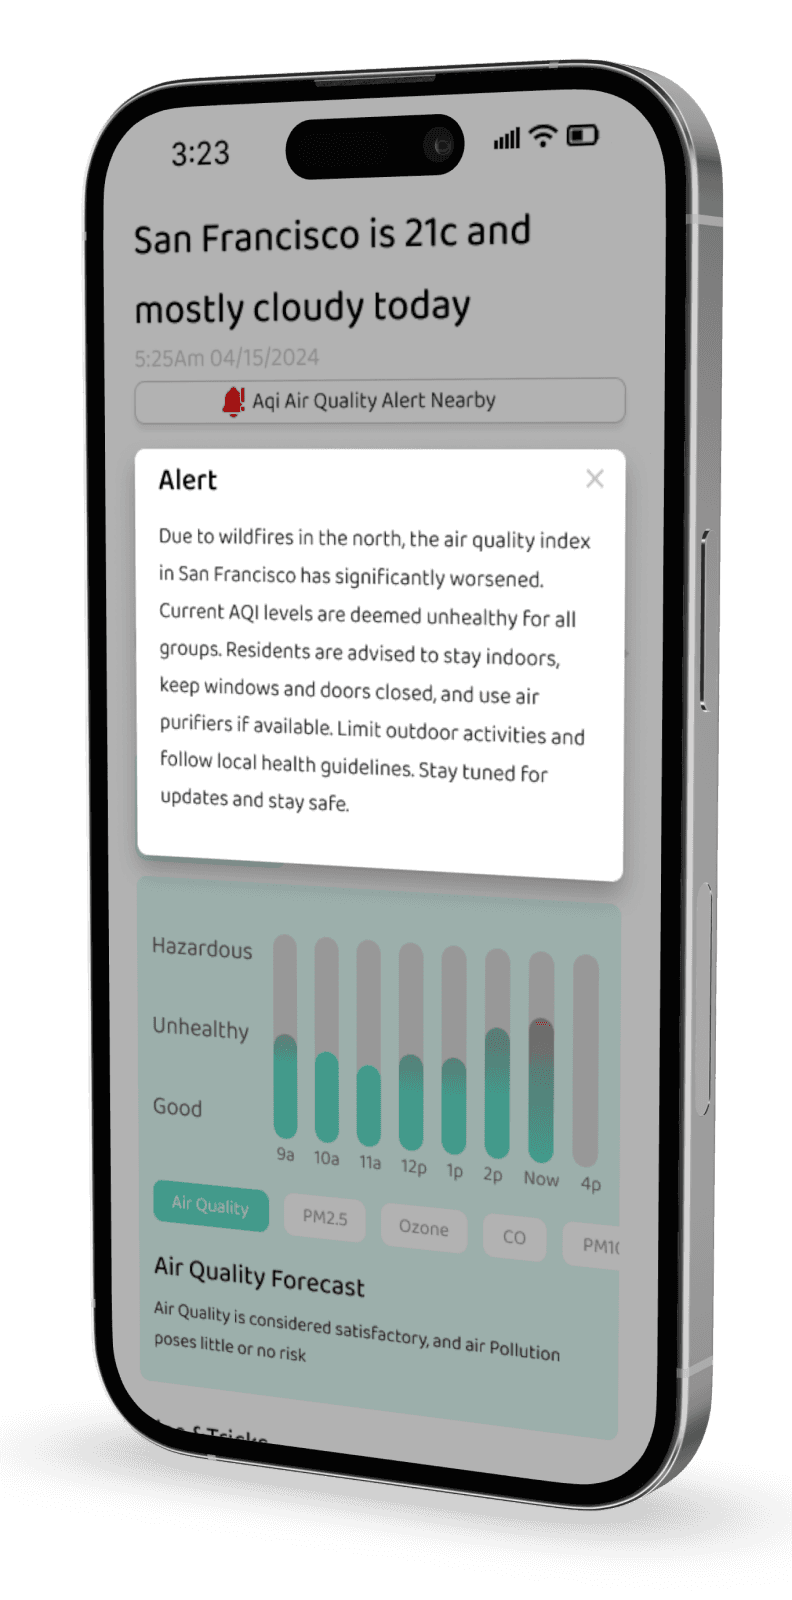
1. Real-Time Data is Valuable: One of the primary values provided by AirAware is its real-time air quality updates. Users appreciated the ability to receive up-to-date information, which is crucial for making informed decisions about outdoor activities and health precautions.
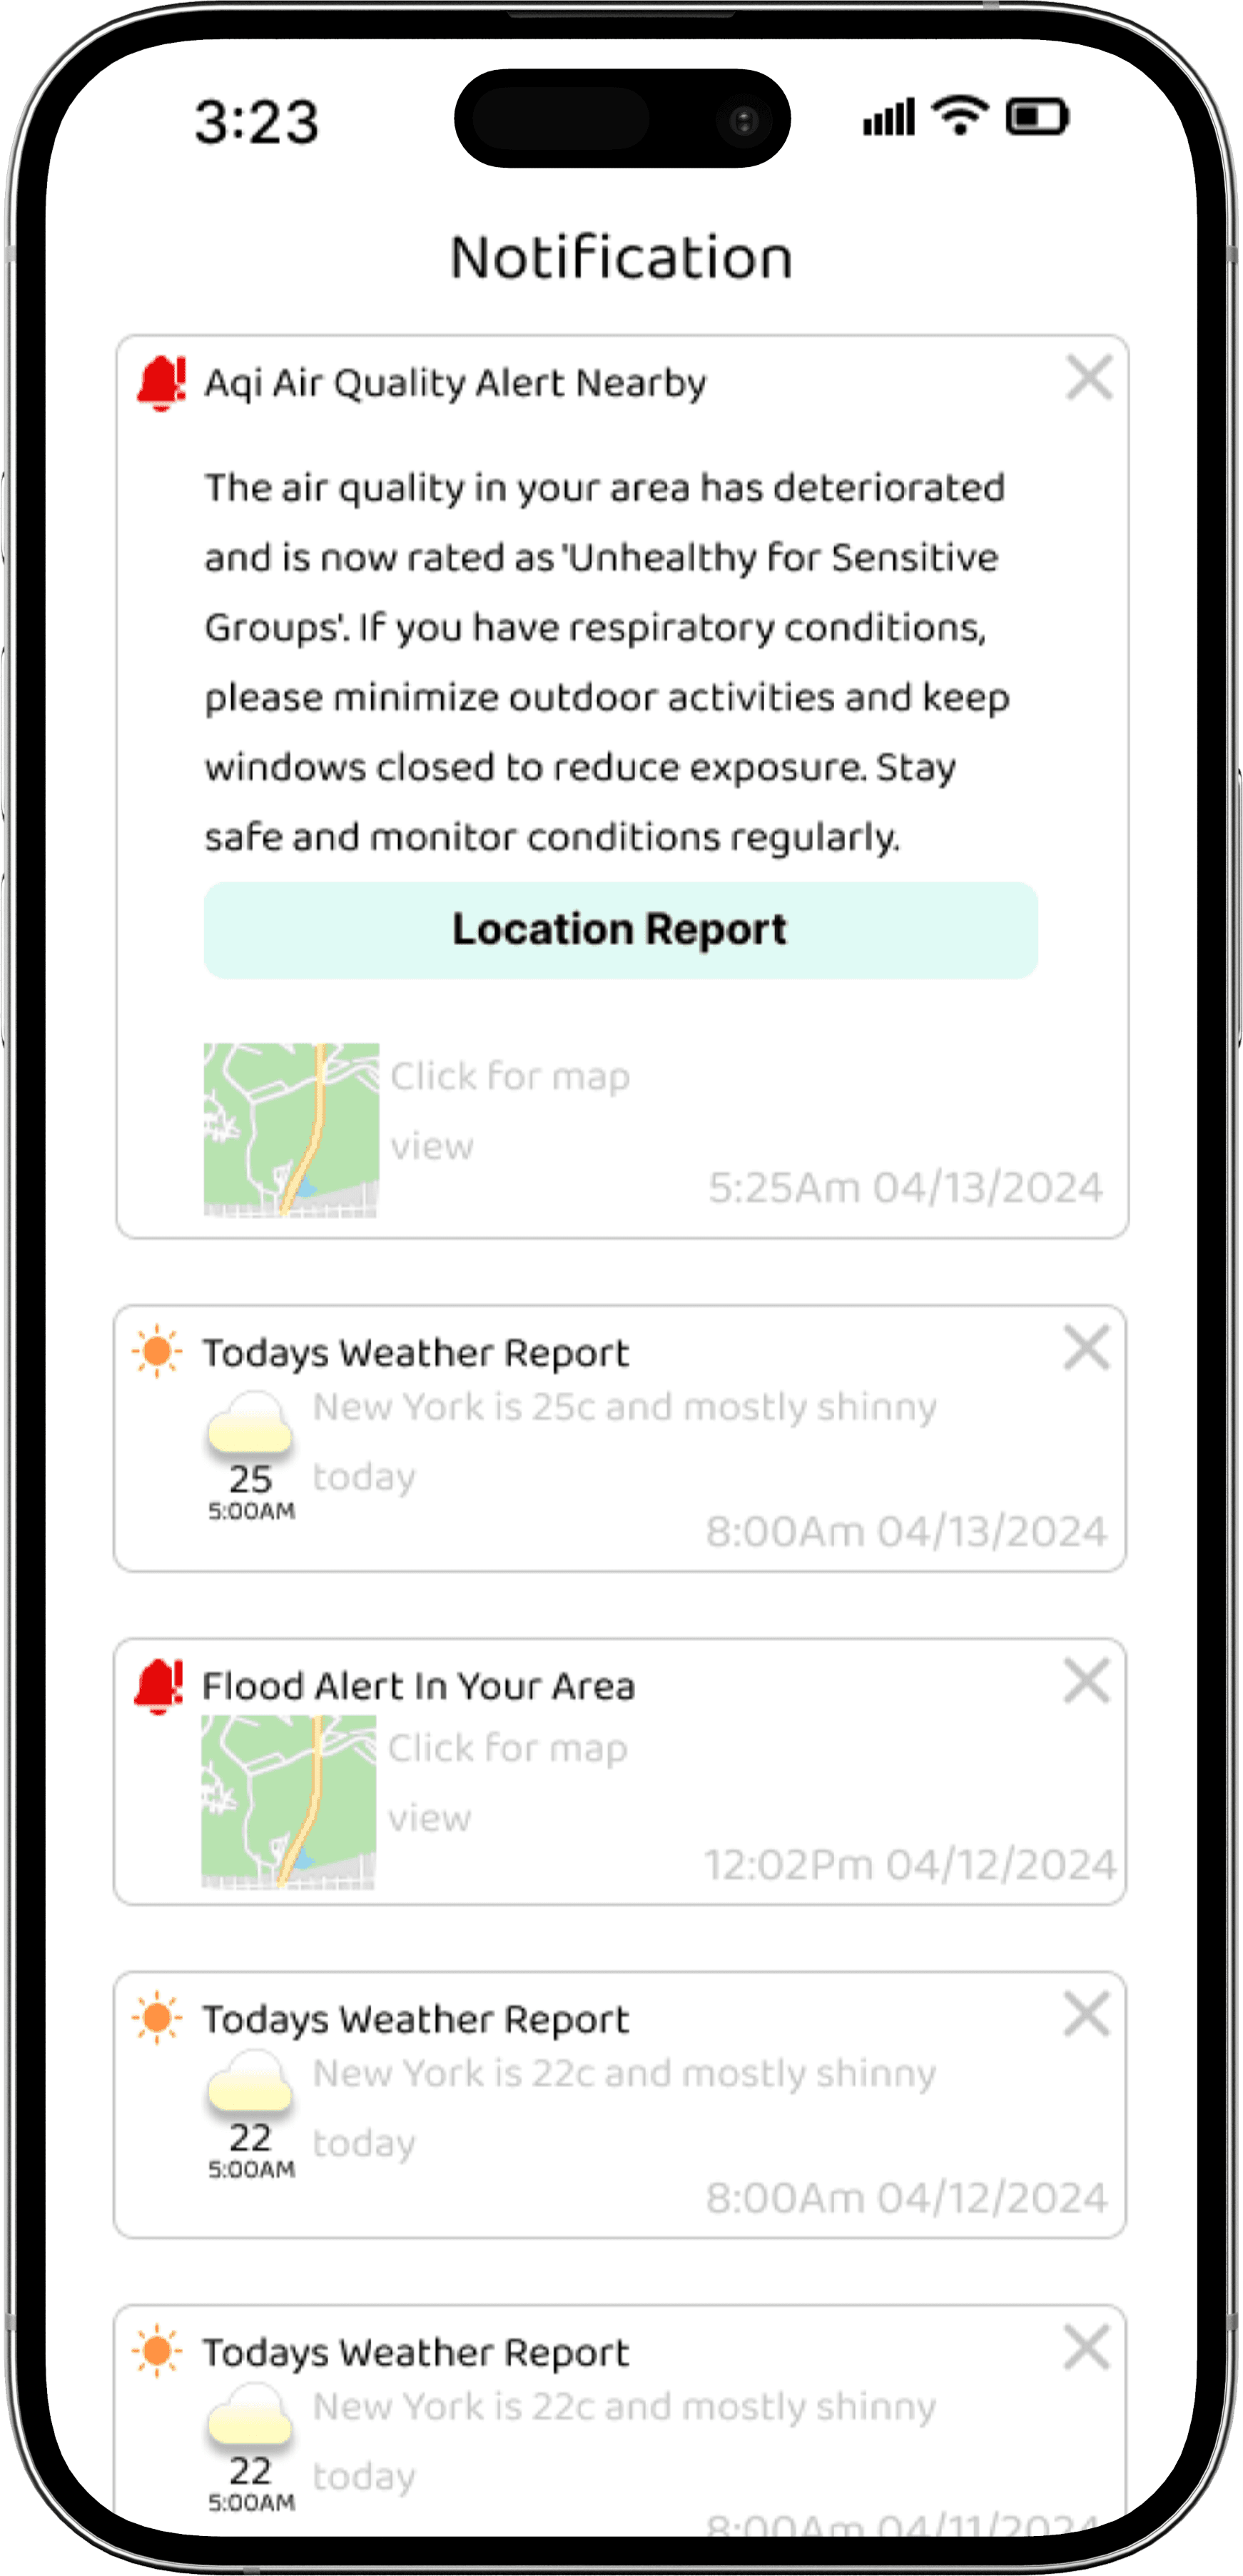
2. Personalization Improves User Experience: Users responded positively to features that allowed them to customize alerts and health recommendations based on their personal health profiles and environmental concerns. This personalization makes the app more relevant and useful to individual users.
Data Metrics
1.User Engagement Metrics:
•Active Users: Aim for a MAU growth rate of 5-10% month-over-month in the initial stages.
•Session Length: An average session length of 2-3 minutes could indicate good engagement.
•User Retention: A target of at least 2-3 interactions per session (e.g., checking air quality, setting alerts).
2.Health Impact Metrics:
•Self-Reported Health Changes: Aiming for 30-40% of users reporting a perceived improvement in managing health due to app usage within six months.
•Usage of Health Recommendations: At least 30% of users utilizing the health recommendations monthly.
3.Performance Metrics:
•App Reliability: Target a crash rate of less than 1%.
•Response Times: Aim for data fetching and display times of under 2 seconds.
UI Components
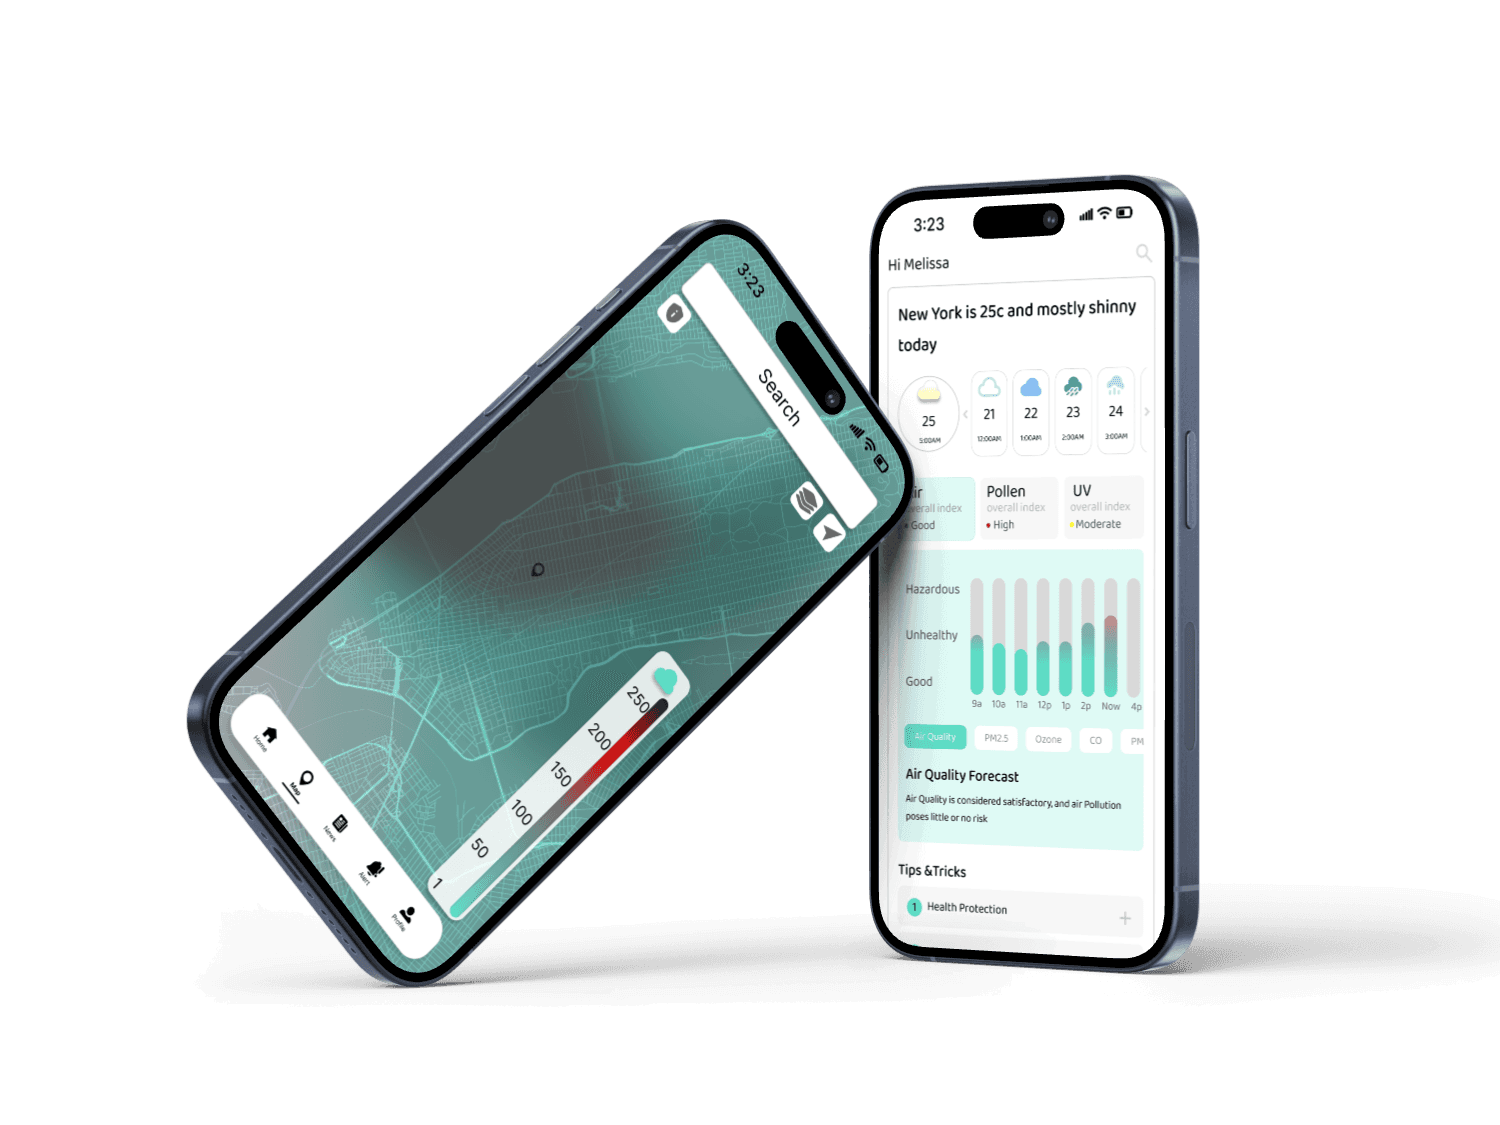
The UI components of AirAware are clean and simple, featuring a light cyan color palette that evokes a sense of fresh air. This design promotes ease of use and ensures essential information is presented clearly and concisely.
Search
Active
Inactive
Body Regular 15px
Heading ExtraBold 22px
Subheading 1 Bold 18px
Subheading 2 Medium 16px
Functional Text Semi Bold 12px, 18px
Baloo
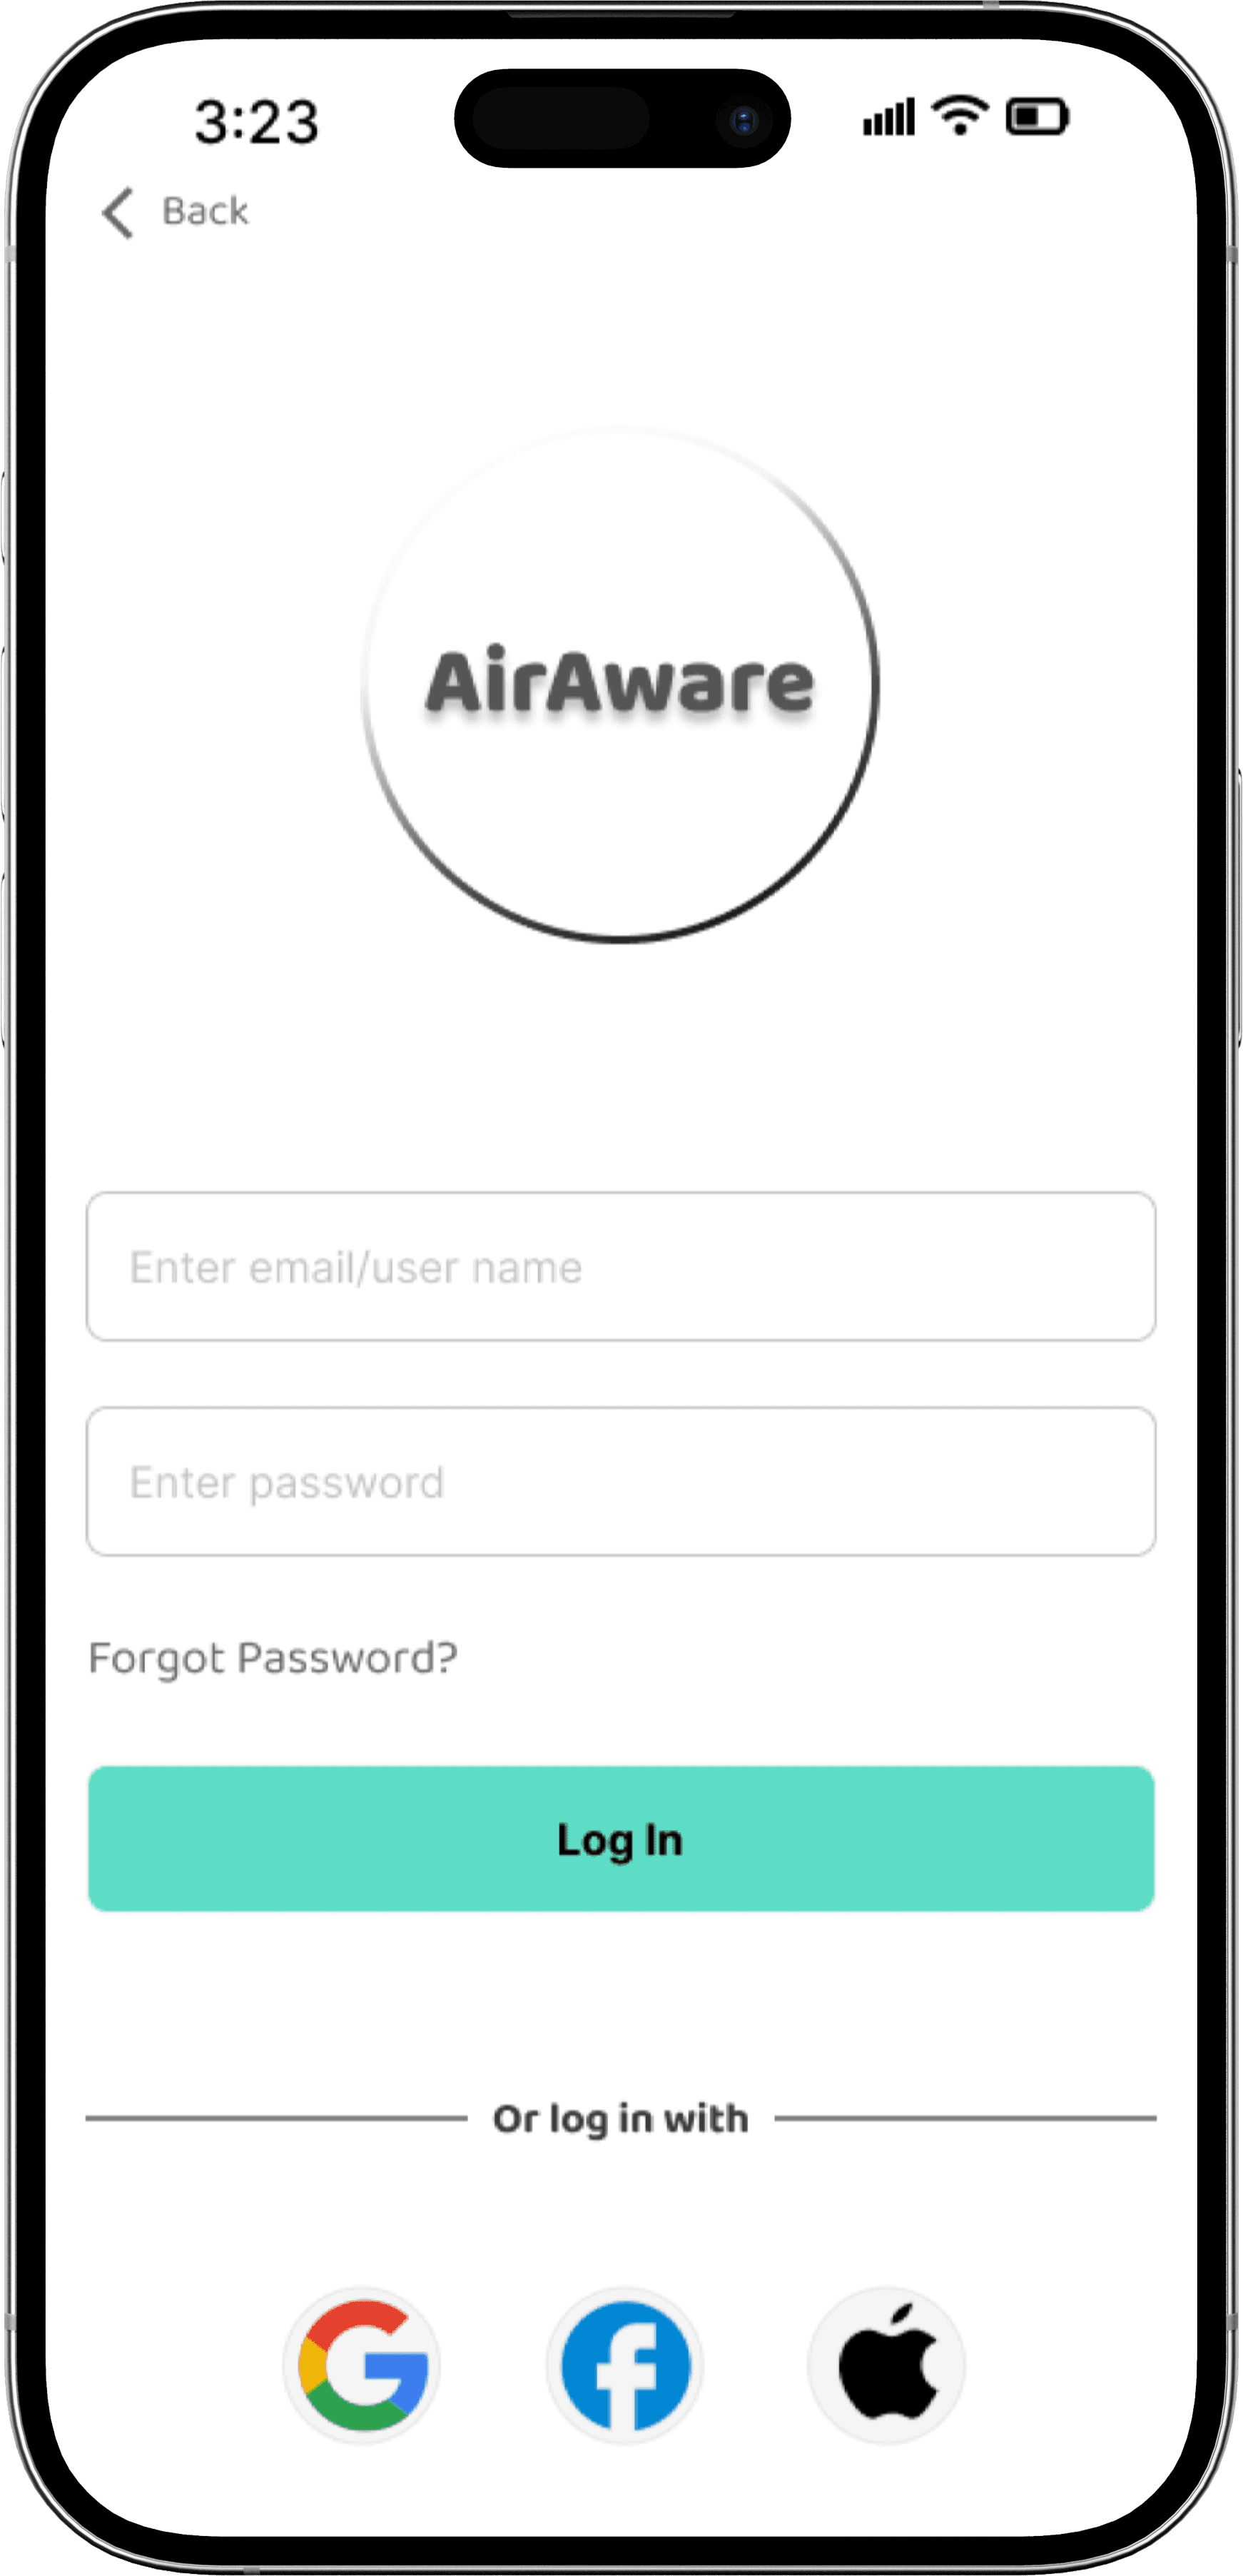
login
Search
enter email/user name
back
log in
enter password
Home
Search
Upload
Community
Profile
Wireframe


Airaware
Get Real Time Air Quality Updates and Health Remmendations

Role
UX Researcher | UX/UI Designer
Project Length
1 month
Tools
Figma, Zoom, Maze
Platform
Mobile
Project Type
Solo - Concept
Project Goal
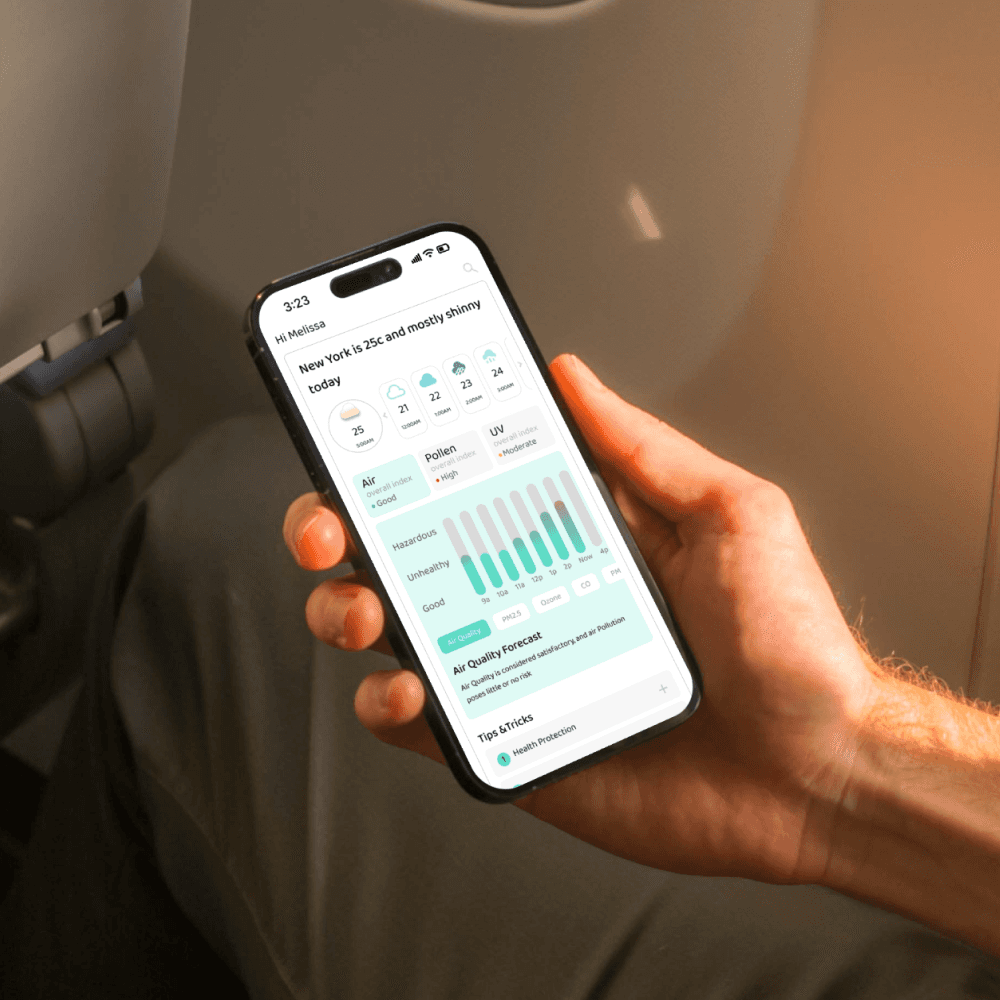
AirAware is a mobile application aiming to help urban residents manage their health by providing real-time air quality updates and personalized health recommendations.

The Problem
AirAware aims to solve the problem of insufficient access to localized and timely air quality information for urban residents, enabling them to make informed decisions about their daily activities and health in response to fluctuating environmental conditions.
Key screen highlight

Research
Click to view full research process (detailed comparison, User interviews, Personas)
User research
Competitor anaylysis
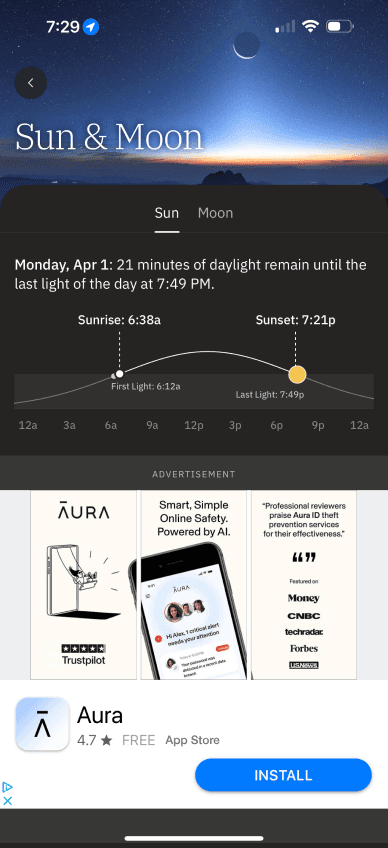
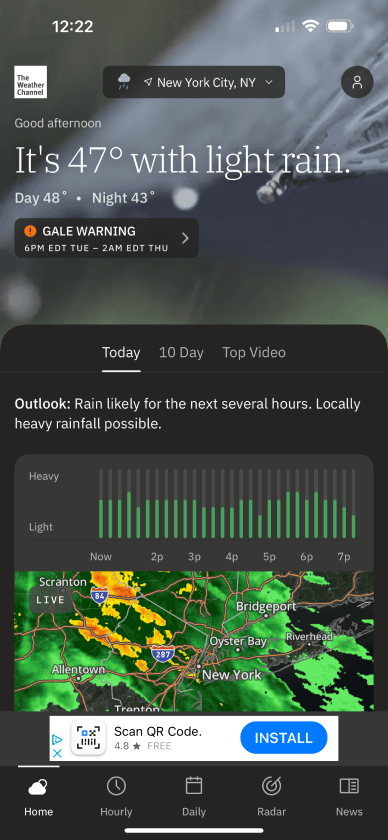
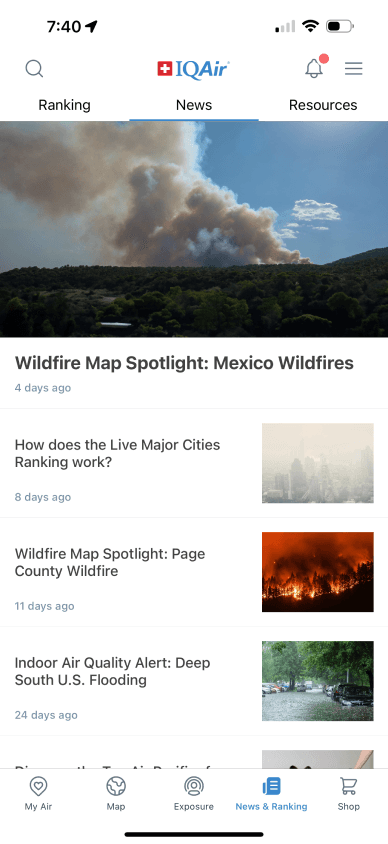
1.The Weather Channel App
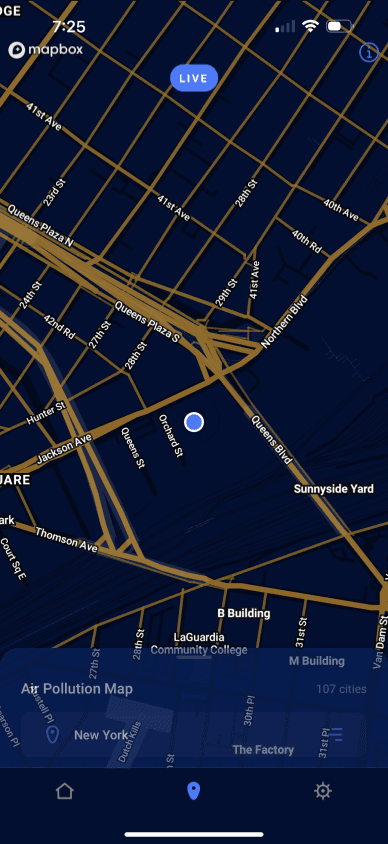
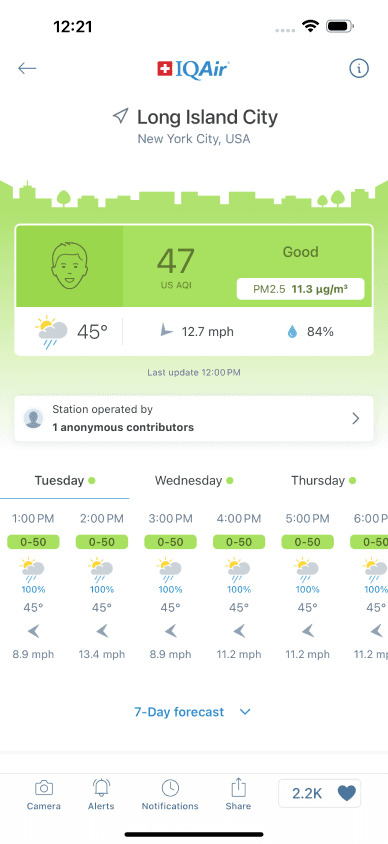
2.IQAir (AirVisual)
3.Plume Labs


This analysis underscores opportunities for AirAware to stand out by focusing on personalized health recommendations, community engagement, and hyper-local data, addressing gaps left by competitors.
80% felt their daily routine is affected by pollution of water
100% has encountered minor health change or issues
60% is dealing with hair loss problems
40% is dealing with respiratory problems
80% desires a more transparent information from the government